0x000001d5 BSOD Fixes: What It Means and How to Act
0x000001d5 is a Windows BSOD stop code you should triage by confirming the hex format, checking memory dumps, and matching recent driver or hardware changes before making fixes. Skip that, and you can replace the wrong part, hide the real fault, and keep a machine in a crash loop. This guide shows how to classify the crash from the stop-code pattern, dump evidence, and trigger history, then choose the next best step.
This guide is part of our Windows BSOD stop codes: full list and fixes series.
What 0x000001d5 means on a blue screen
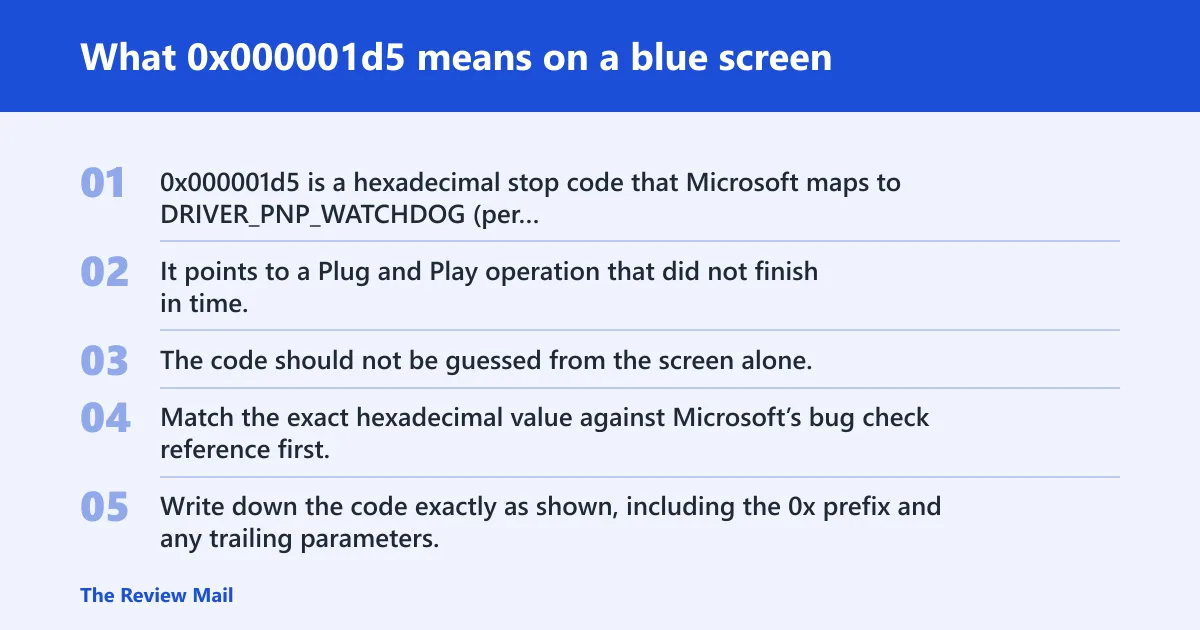
0x000001d5 is a hexadecimal stop code that Microsoft maps to DRIVER_PNP_WATCHDOG (per Microsoft support). It points to a Plug and Play operation that did not finish in time, so the screen is the same event whether you call it a BSOD, bug check, or stop code.
The code should not be guessed from the screen alone. Match the exact hexadecimal value against Microsoft’s bug check reference first, then use any parameters and dump evidence to narrow the path to driver, storage, memory, or power.
What to capture if the screen disappears too fast
Write down the code exactly as shown, including the 0x prefix and any trailing parameters. If Windows reboots too fast, disable automatic restart after system failure, then photograph the screen on the next crash.
Capture the last thing the machine was doing: a driver install, Windows Update, docking station attach, external drive use, sleep or wake, or a sudden power cut. That trigger history matters more than guesswork.
What Microsoft says to check first
Start with Microsoft’s bug check code reference, then check whether a dump file exists, then follow the customer or IT path that matches your role. Microsoft says the reference lists common bug check codes shown on the bug check screen, and it provides code-to-name mappings for troubleshooting.
Use the code reference before changing anything
Look up the exact stop code in Microsoft Learn’s bug check code reference. If the default number base is not hexadecimal, prefix the code with 0x. For deeper inspection, Microsoft recommends WinDbg’s !analyze extension, with syntax like !analyze -show <code>; Microsoft also shows the parameterized example !analyze -show 0x9F 0x3.
Check for a dump file
Microsoft says a bug check dump file might be available after a crash. That file contains more information about the memory contents when the stop code occurred, and it can be enough to identify the fault path without swapping parts first. (Microsoft Learn)
Use the customer-facing Resolving Blue Screen errors in Windows guidance for home systems and the Advanced troubleshooting for stop code errors guidance when you need IT-level diagnosis.
Stop-code triage worksheet for 0x000001d5
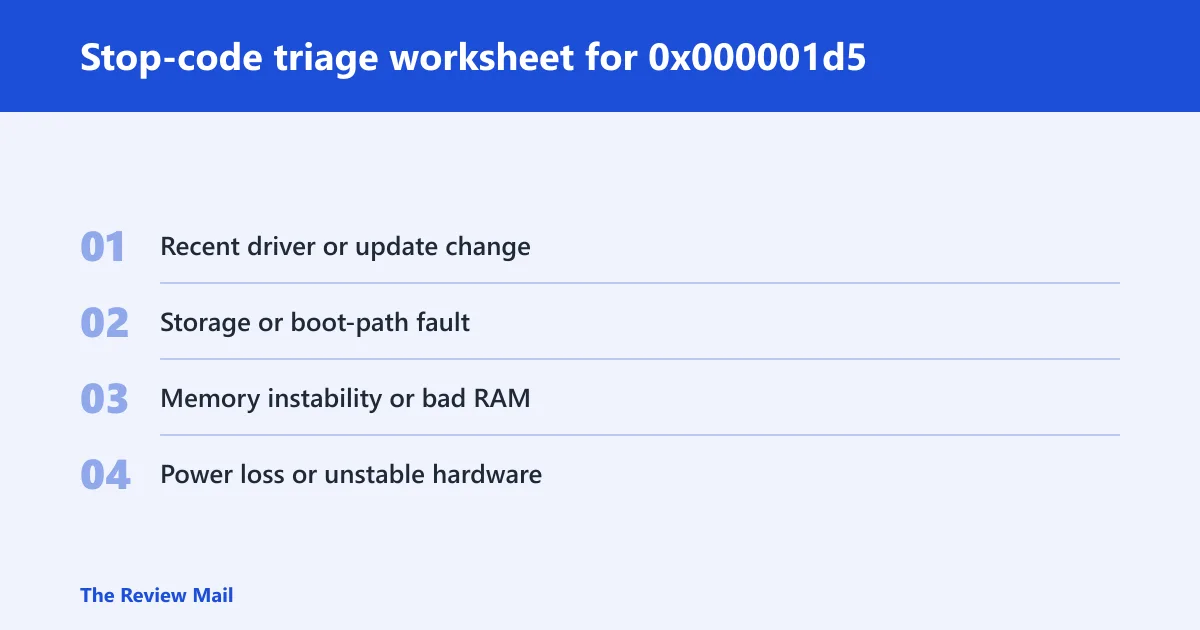
This worksheet keeps the evidence together before any fix. Use it once, then decide whether the crash looks like a driver, storage, memory, or power problem.
| Field | What to record | Why it matters |
|---|---|---|
| Exact code capture | 0x000001d5, all parameters, and whether the machine rebooted immediately | Prevents the wrong code path |
| Last change checklist | Driver install, Windows Update, app install, new USB device, dock, BIOS change, power event | Sorts trigger history fast |
| Dump-file availability | Mini dump, kernel dump, or full dump; file present or missing | Decides whether analysis can be local |
| Parameter checklist | All stop-code parameters exactly as shown | Some cases need parameter-aware analysis |
| Symptom note | Boot loop, install failure, external-device trigger, disk noise, wake failure | Points toward the right subsystem |
Likely causes, ranked by how they usually show up
- Recent driver or update change. The crash often appears after a new driver, Windows update, dock firmware, or app that installs a filter driver.
- Storage or boot-path fault. A drive that stalls, a loose cable, or a bad boot path can leave PnP work hanging.
- Memory instability or bad RAM. Bad memory can distort the data the watchdog needs to finish PnP work.
- Power loss or unstable hardware. Sudden power drops, failing adapters, or flaky mainboard power delivery can create repeat crashes.
Is this a driver problem or a hardware problem?
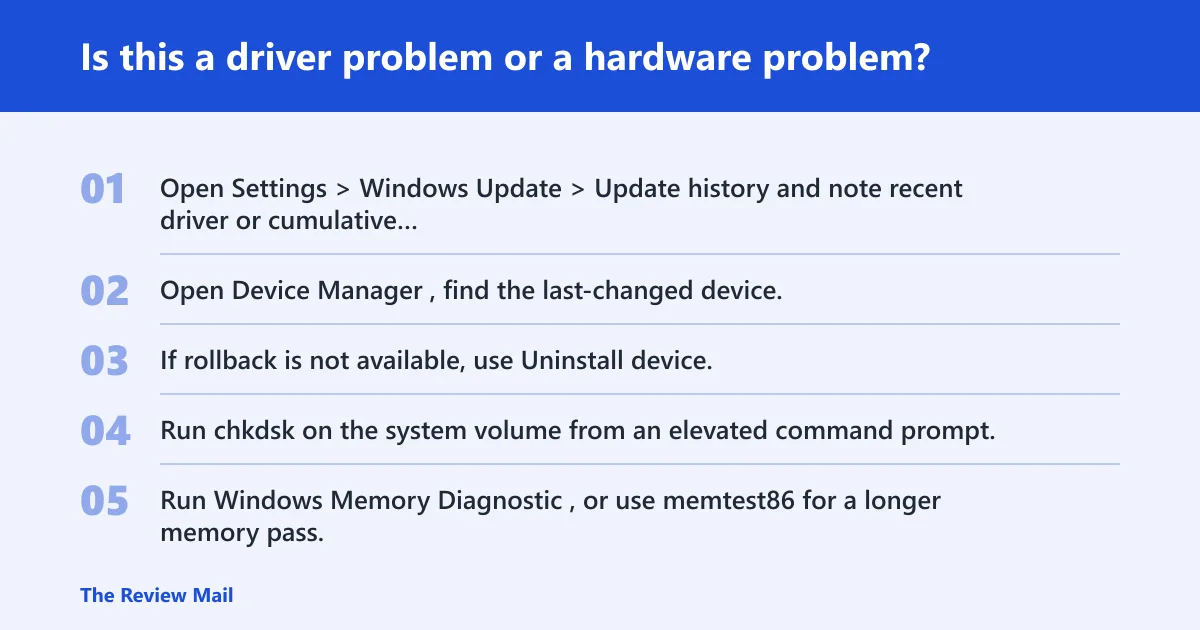
This stop code can be either, so use the pattern. If the crash started right after a driver, dock, printer, or USB device change, treat it as a driver path first. If it appears during boot, disk access, wake, or power events, storage or hardware moves higher.
Signs it points to a driver or app change
- Open Settings > Windows Update > Update history and note recent driver or cumulative updates.
- Open Device Manager, find the last-changed device, and use Properties > Driver > Roll Back Driver if available.
- If rollback is not available, use Uninstall device, then reboot and let Windows reload a basic driver.
Signs it points to storage or memory
- Run
chkdskon the system volume from an elevated command prompt. - Run Windows Memory Diagnostic, or use memtest86 for a longer memory pass.
- Check whether the crash happens only on boot, resume, or when a specific disk is attached.
When the pattern looks like power or motherboard trouble
- Disconnect nonessential USB devices, docks, and external storage.
- Test with a known-good power adapter or outlet.
- If the machine still reboots during PnP activity, move to a technician-level parts isolation test.
How to find the stop code details in WinDbg
WinDbg is the deeper tool for kernel-mode analysis, and Microsoft recommends its !analyze extension to display bug check information. Use it when the dump file exists and the code still needs parameter-aware inspection.
Open the dump and run the analysis
- Open the dump file in WinDbg.
- Run
!analyze -show 0x000001d5. - If parameters are shown, inspect them as part of the same failure path.
- If the code is not accepted as hexadecimal by default, prefix it with
0x.
Why kernel-mode analysis matters
PnP failures often sit below the app layer. Kernel-mode analysis can show the stalled driver path, the power transition, or the device stack involved, which is far more useful than chasing the last thing the user clicked.
Fixes by cause: what to do next
Use the smallest change that matches the evidence. If the stop code follows a known trigger, fix that path first instead of reinstalling Windows or replacing hardware at random.
If a driver or update changed recently
- Open Device Manager and roll back the most recent device driver.
- If that fails, uninstall the device and reboot.
- Open Settings > Windows Update > Update history and remove the last update only if the timing lines up tightly with the crash.
If storage is suspected
- Run
chkdskon the Windows volume. - Check SATA or NVMe seating, then reattach external drives one at a time.
- Run
sfc /scannow, thenDISM /Online /Cleanup-Image /RestoreHealthif Windows files may be damaged.
If memory is suspected
- Run Windows Memory Diagnostic from the Start menu.
- For a longer pass, use memtest86.
- Reset any overclocking or unstable memory settings in firmware.
If power or hardware is suspected
- Remove nonessential peripherals.
- Test on AC power with a known-good adapter.
- If available, swap in known-good storage or RAM one item at a time.
Prevention: After a fix, reboot three times, then sleep and wake the machine once. If the stop code does not return, reconnect devices one by one so the trigger stays visible.
Still not working?
If Windows keeps rebooting, boot into Safe Mode or use a clean boot via msconfig to narrow the trigger. If the machine still hits the same stop code there, the fault is probably below the normal desktop layer and needs stronger evidence.
Three-step escalation path
- Home user: Save the exact code, collect the dump file if present, and try one cause-specific fix only.
- IT admin: Compare the crash time with driver, firmware, and update deployment logs; then review the dump in WinDbg.
- Repair technician: Isolate storage, RAM, and power with known-good parts before replacing the board.
If the system will not stay up long enough to work, move the drive to another system for dump extraction or send the unit for vendor support with the captured code, parameters, and trigger history.
Frequently asked questions
What does 0x000001d5 mean on a Windows blue screen?
It maps to DRIVER_PNP_WATCHDOG and points to a Plug and Play operation that did not finish in time. Capture the exact code and any parameters, then check the dump file if one exists before changing drivers or parts.
Is 0x000001d5 a driver problem or hardware problem?
Either is possible. If the crash follows a driver, dock, or Windows update, start with Device Manager rollback or uninstall. If it appears during boot, wake, or disk access, check storage, memory, and power next.
How do I find the stop code details in WinDbg?
Open the dump file, then run !analyze -show 0x000001d5. If the code or parameters are shown in another base, prefix the value with 0x. Review the parameter list before deciding which subsystem failed.
What should I check first after a BSOD with 0x000001d5?
Check the exact code, the parameters, and the last change on the machine. Then see whether a dump file exists. If it does, use it before rolling back drivers or replacing hardware.
Can dump files tell me why this stop code happened?
Yes. Microsoft says the dump file contains more information about memory contents when the stop code occurred. That is often enough to show whether the crash sits in a driver stack, storage path, or memory-related failure.
What does Microsoft recommend for resolving blue screen errors?
Use the bug check code reference, inspect any dump file, then follow the customer or IT troubleshooting path that fits the system. For deeper cases, open the dump in WinDbg and use kernel-mode analysis with !analyze -show <code>.