0x0000011d BSOD: What It Means and What to Check First
0x0000011d is a Windows bug check code that maps to EVENT_TRACING_FATAL_ERROR. If the blue screen keeps returning, focus first on what changed most recently and on any dump file you can collect before rebooting again. Because this stop code is tied to event tracing, the most useful next step is to check whether a recent tracing-related service, driver, or vendor utility is involved.
What 0x0000011d means on a blue screen
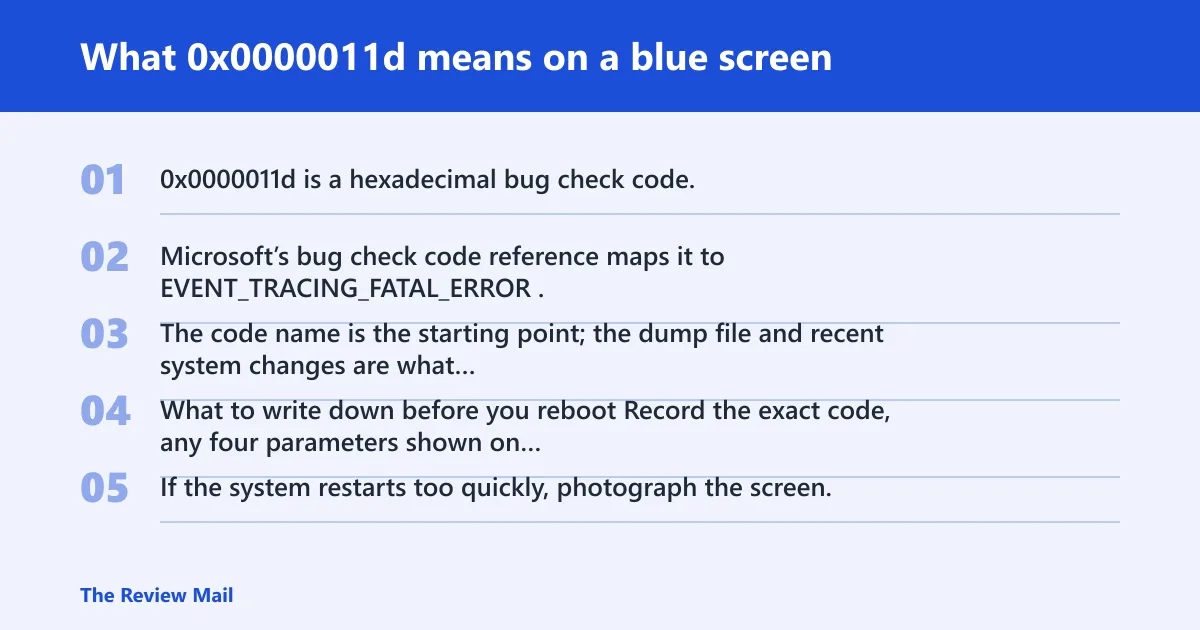
0x0000011d is a hexadecimal bug check code. Microsoft’s bug check code reference maps it to EVENT_TRACING_FATAL_ERROR. The code name is the starting point; the dump file and recent system changes are what help narrow down the cause on your machine.
What to write down before you reboot
Record the exact code, any four parameters shown on the blue screen, and whether the crash followed a driver install, firmware change, or vendor software update. If the system restarts too quickly, photograph the screen. Save the time of the crash as well so you can line it up with Event Viewer entries and any dump timestamps.
How this code differs from a plain crash message
A plain app crash points to one process. A bug check means Windows stopped itself because kernel-mode activity became unsafe. For 0x0000011d, that usually means you need to look at event-tracing-related components and the dump evidence instead of treating it like a generic desktop app failure.
Likely causes of 0x0000011d, ranked
Because the code is tied to event tracing, start with the most recent tracing-related driver, service, or vendor utility change. If the issue began after a support or remediation tool updated, that is especially worth checking. After that, review firmware changes and only then move on to broader hardware checks if the crash keeps repeating.
Recent driver or filter changes
Windows driver debugging is the right path when the crash began after new software, endpoint protection, storage filters, or vendor utilities. A known reported example is Dell SupportAssist on some Windows 11 systems; Windows Central reported that version 5.5.16.0 was tied to BSOD crashes, and Dell said version 5.5.16.0 of the Dell SupportAssist Remediation service or Alienware SupportAssist Remediation service can cause the BSODs. Windows Central also reported that Microsoft’s WinDbg traced the issue to DellSupportAssistRemediationService.exe. In that reported case, Dell recommends uninstalling the software.
- Open Settings > Apps > Installed apps and uninstall recently added vendor utilities, especially support or remediation tools.
- Open Settings > Windows Update > Update history > Uninstall updates and remove the most recent update only if the crash began immediately afterward.
- Open Device Manager, expand the affected device, choose Properties > Driver > Roll Back Driver if that option is available.
- If the crash started after installing a tracing or support service, boot Safe Mode and remove that software there.
Firmware, BIOS, or storage controller issues
If the crash began after a BIOS or firmware update, review those settings next. Confirm whether any low-level storage or controller setting changed at the same time as the blue screens. For an event-tracing-related stop code, a recent firmware change can still be relevant if it changed how devices initialize or report events.
- Enter firmware setup and note the BIOS or UEFI version.
- Load optimized defaults, then remove overclock or memory tuning settings.
- Confirm storage mode and controller settings match the installed OS configuration.
- Boot Windows and retest before changing more than one setting at a time.
Memory, disk, or other hardware faults
If the same stop code returns after you remove the newest software and check firmware, collect hardware evidence. A failing SSD, unstable RAM, or intermittent power problem can still contribute to system instability and repeated bug checks. At that stage, the dump file and basic hardware checks are more useful than guessing.
- Run
sfc /scannowfrom an elevated Command Prompt. - Run
DISM /Online /Cleanup-Image /RestoreHealth. - Run
chkdskC: /f on the system volume. - Use Windows Memory Diagnostic or memtest86 to test RAM.
How do I look up 0x0000011d in Microsoft’s reference?

Use Microsoft Learn’s bug check code reference to confirm the code name first. It is a catalog of bug check codes and their names, which helps you verify that 0x0000011d maps to the event-tracing error before you start deeper analysis. After that, move to the dump and recent change history.
Reading the code and name columns
Look for the hexadecimal code in the table, then read the name beside it. The reference format lets you confirm the stop code without relying on memory or assumptions. For 0x0000011d, the name is EVENT_TRACING_FATAL_ERROR.
When the reference stops and debugger analysis begins
The reference tells you the bug check name. It does not tell you which service, driver, or firmware path caused the crash on your machine. Once you know the code name, use the dump file and WinDbg to inspect the stack and the modules involved.
How do I read a Windows bug check code in WinDbg?
Use WinDbg when you have a dump file and need kernel-mode analysis. Open the dump, inspect the bug check parameters, and review the stack and any faulting module names. (Microsoft Learn)
Running analysis in WinDbg
Open the dump in WinDbg, then review the bug check details shown for the crash. Focus on the stop code, the parameters, and the modules on the stack. If the same vendor service appears repeatedly, that is more useful than guessing from the blue screen alone.
What to look for in parameters and stack data
Focus on the bug check parameters, the faulting module, and any repeated driver or service names on the stack. Those details help you decide whether the problem sits in a vendor utility, an event-tracing component, or a broader hardware path. Kernel-mode analysis needs the dump context, not just the code name.
Which dump files help identify the cause of a BSOD?
The best file depends on how much state you need. A dump file can preserve memory contents and crash context that are not visible on the blue screen itself. For 0x0000011d, that extra state can show whether a vendor service, driver, or lower-level component was active at the time of failure.
| Evidence source | What it can show | Best next step |
|---|---|---|
| Minidump | Stop code, faulting module, basic stack | Open it in WinDbg and compare recent software changes |
| Kernel-mode dump file | Memory contents, register state, deeper kernel context | Trace the service or driver path in WinDbg |
| Live dump | Memory information without stopping the OS | Use when the machine must stay available during capture |
| Event Viewer / hardware logs | Crash timing, disk or firmware warnings, reboot sequence | Correlate with dump timestamps; do not use alone as proof |
Minidump versus kernel-mode dump versus live dump
A minidump is the quickest starting point. A kernel-mode dump file is better when the first pass is inconclusive because it contains more memory contents at failure time. A live dump is useful when the system needs to keep running while you capture memory information during an abnormal event.
What each file can prove or rule out
A minidump can point to a driver or vendor service that was active during the crash. A kernel dump can show whether the kernel was already in an unsafe state before the bug check. A live dump can capture a bad state during an intermittent failure. Event Viewer helps with timing, but it cannot prove root cause on its own.
Stop-code triage table for 0x0000011d
| Symptom | Likely evidence source | Next step |
|---|---|---|
| Crash started after a driver or vendor app update | Minidump | Rollback or uninstall the recent driver or app |
| Crash loops during boot or after firmware changes | Kernel-mode dump file | Check the stack and any service names in WinDbg |
| Crash appears only after a support or tracing utility update | Minidump | Remove the utility and retest |
| System must stay running while the fault is captured | Live dump | Collect the live dump, then analyze in WinDbg |
What should I check first after a stop code 0x0000011d crash?
Check the last change first: driver installs, updates, vendor utilities, and firmware changes. If nothing obvious changed, collect the minidump before doing repairs. That keeps you from replacing working parts while the real fault stays hidden in the stack or in a support service.
What to collect before reinstalling Windows or swapping parts
- Save the latest minidump and any newer kernel-mode dump file.
- Export Event Viewer logs for the crash time window.
- Record BIOS or UEFI version, storage mode, and recent hardware changes.
- List recent driver installs, updates, and vendor software changes.
If that didn’t work, try this next
Move from software rollback to firmware checks, then to storage and memory tests. If the crash survives all three, the next step is debugger-led analysis with the dump and the stack trace. At that point, the problem is no longer basic consumer triage.
How is 0x0000011d different from other stop codes in the 0x1x range?
It is different because the code name points to event tracing, not to a generic memory label or a broad driver family. The 0x1x range contains many unrelated bug checks, so the code name matters more than the number family. That is why a code-to-name lookup comes first.
Why this code needs more evidence than a simple lookup
The bug check reference is lookup-oriented. It tells you the name, but not which service, driver, or firmware condition triggered the crash on your machine. A debugger and dump file tell that story; the table alone does not.
When should I use Microsoft documentation versus a debugger for this stop code?
Use Microsoft documentation first when you need the code name and a broad map. Use WinDbg when you have a dump file and need to know whether the fault sits in a service, a driver, or another kernel component. If the crash repeats, debugger work is the point where the diagnosis gets real.
Decision rule for users who do not debug kernels
If the crash happened once and followed a clear driver or vendor utility install, start with rollback. If it recurs or the system will not boot cleanly, stop treating it as a guess-and-reinstall problem. Collect the dump, check the stack, and hand it to someone who can read kernel traces.
Can a live dump help with a stop code investigation?
Yes. A live dump can help when the operating system should keep running while memory information is captured during an abnormal event. It is useful when the machine is unstable but still usable enough to collect evidence. It is not the first thing to reach for when a standard dump is already available.
When to use a live dump instead of a crash dump
Use it when the failure is intermittent, service-impacting, or hard to reproduce after reboot. If the machine already blue-screened, a standard dump file is usually easier to obtain. For 0x0000011d, the live dump is a tool for evidence capture, not a substitute for the bug check reference.
Still not working? What to send to an expert
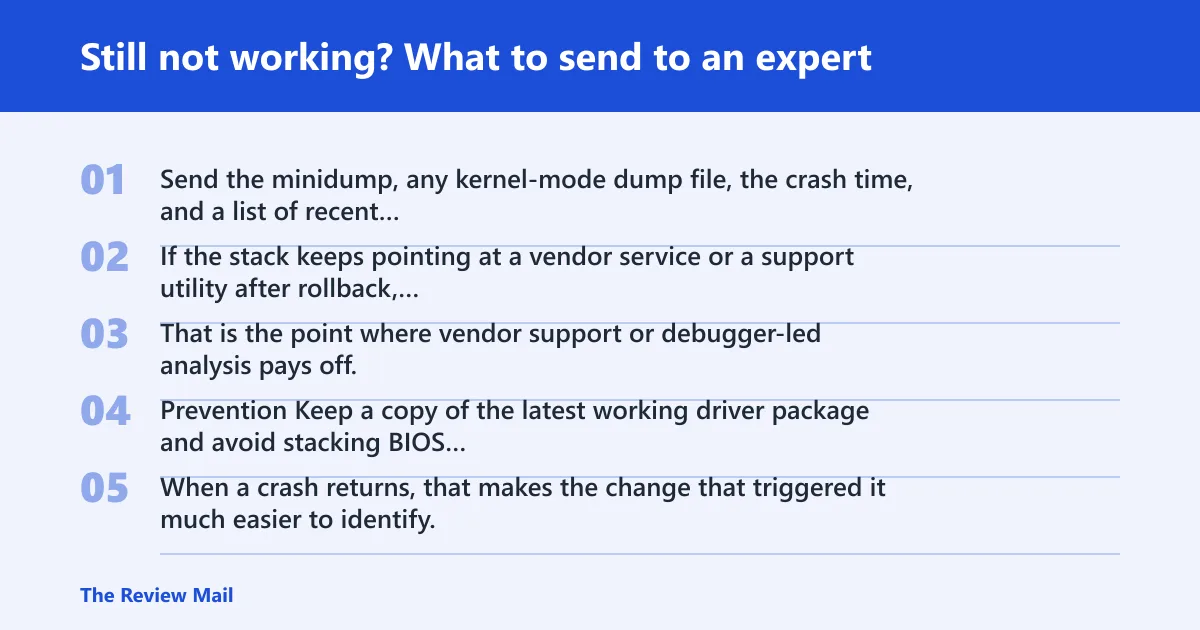
Send the minidump, any kernel-mode dump file, the crash time, and a list of recent driver, firmware, and software changes. If the stack keeps pointing at a vendor service or a support utility after rollback, remove that software and retest before swapping parts blindly. That is the point where vendor support or debugger-led analysis pays off.
Prevention
Keep a copy of the latest working driver package and avoid stacking BIOS changes with driver updates on the same day. When a crash returns, that makes the change that triggered it much easier to identify.
Frequently asked questions
What does 0x0000011d mean on a Windows blue screen?
It maps to EVENT_TRACING_FATAL_ERROR. The code identifies the stop condition, but the cause still has to be proven with a dump file, stack trace, or related logs. On its own, the number is a lookup key, not a root-cause report.
Is 0x0000011d a driver, memory, or hardware problem?
Any of the three is possible, but the first thing to check is recent event-tracing-related software or a vendor utility update. Then check firmware changes, then run memory and disk tests if the crash keeps returning. If WinDbg keeps pointing at the same module or service, that is stronger than a guess based on symptoms alone.
What should I check first after a stop code 0x0000011d crash?
Check the most recent change, then preserve the minidump. Open Settings > Apps > Installed apps and review newly added vendor utilities, then save the dump before rebooting too many times. If the crash repeats, stop changing things until the stack is examined.
How do I read a Windows bug check code in WinDbg?
Load the dump, then review the stop code details, bug check parameters, and faulting module names. Focus on whether a service, driver, or subsystem appears repeatedly in the stack. Those clues are more useful than the code alone.
Which dump files help identify the cause of a BSOD?
A minidump is the first file to check. A kernel-mode dump file is better when you need memory contents and register state. A live dump can help when the machine must continue running. Event Viewer can add timing, but it should not be treated as proof by itself.
When should I use Microsoft documentation versus a debugger for this stop code?
Use Microsoft documentation to identify the code name and basic meaning. Use a debugger when the crash repeats or when you have a dump file and need to decide between driver, firmware, or hardware work. The code reference is the map; WinDbg is the route finder.