0x000000c8: Windows BSOD meaning and fix for IRQL errors
0x000000c8 is the bug check value I decode first; pull the bug check name, four parameters, and dump context from the stop screen, minidump, or WinDbg before picking a fix. Skip that, and you can chase the wrong driver, burn restart cycles, and miss the trigger. This guide shows where to read the code, how to extract the parameters, and how to map them to the crash context.
This guide is part of our Windows BSOD stop codes: full list and fixes series.
What does stop code 0x000000c8 mean in Windows?
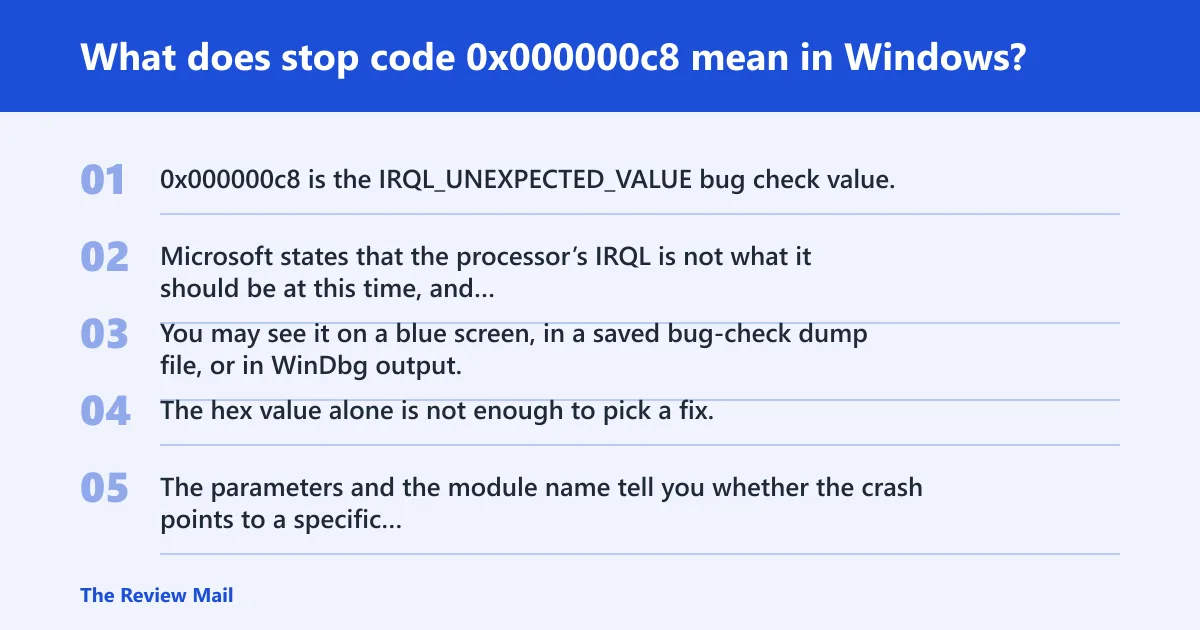
0x000000c8 is the IRQL_UNEXPECTED_VALUE bug check value. Microsoft states that the processor’s IRQL is not what it should be at this time, and that the error is usually caused by a device driver or another lower-level program that changed the IRQL for some period and did not restore the original IRQL at the end of that period.
You may see it on a blue screen, in a saved bug-check dump file, or in WinDbg output. The hex value alone is not enough to pick a fix. The parameters and the module name tell you whether the crash points to a specific driver path or a lower-level component that left IRQL in the wrong state.
What Microsoft calls this stop code
The Microsoft name is IRQL_UNEXPECTED_VALUE. The code value is 0x000000C8.
What to collect before you try any fix
Before changing anything, note the code, the four parameters, any module name that is listed, and the crash timestamp. Save the original dump. Then decode the stop code in WinDbg. That order matters because the dump context can change the diagnosis.
| Intake field | What to record | Where to find it | Why it matters |
|---|---|---|---|
| Stop code | 0x000000c8 | BSOD screen, dump file header, WinDbg output | Confirms the bug check name lookup |
| Bug-check name | IRQL_UNEXPECTED_VALUE | Microsoft bug check reference, WinDbg | Maps the hex value to the condition |
| Parameters | Argument 1 through Argument 4 | BSOD screen, WinDbg | Narrows the failure context |
| Module name | Referenced driver or program name | WinDbg !analyze output | Points to the component to inspect first |
| Timestamp | Crash time and update time | Dump properties, Windows Update history | Helps compare crash timing to recent changes |
Where to find the four bug-check parameters
Read the parameters directly from the crash screen if they are shown there. If not, open the dump in WinDbg and use the analysis output. Microsoft recommends WinDbg for stop code information, and it can show a specific code with the -show syntax and include stop code parameters. (Microsoft Learn)
How do you read 0x000000c8 in WinDbg?
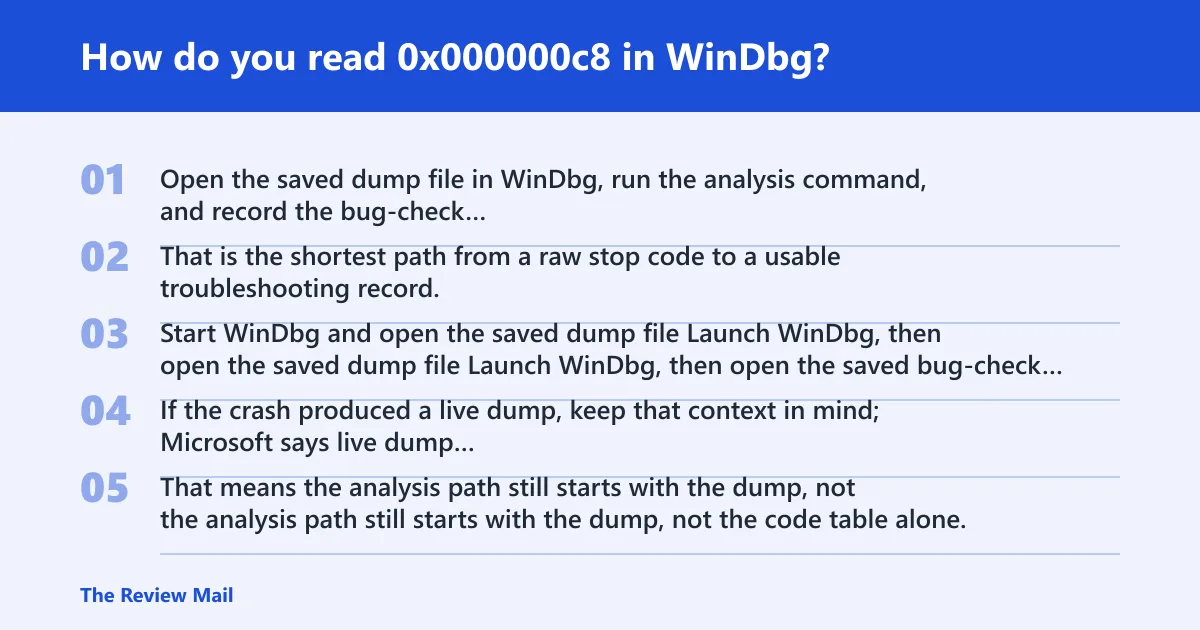
Open the saved dump file in WinDbg, run the analysis command, and record the bug-check name, the four parameters, and any module name that the output points to. That is the shortest path from a raw stop code to a usable troubleshooting record.
Start WinDbg and open the saved dump file
Launch WinDbg, then open the saved bug-check dump file. If the crash produced a live dump, keep that context in mind; Microsoft says live dump stop codes do not reset the OS, and they are not listed in the bug check reference page. That means the analysis path still starts with the dump, not the code table alone.
Run the analysis command and note the bug-check name
Use !analyze to pull the stop code information from the dump. Microsoft says WinDbg can show a specific code with the -show syntax, and it can include the stop code parameters. If the output names a module, record that exact module name before doing anything else.
Record the parameters and any module name
Write down Argument 1, Argument 2, Argument 3, and Argument 4 exactly as shown. Then save the module name, the crash timestamp, and the dump file path. If the first analysis is vague, do not guess a fix yet. Preserve the dump and collect another crash sample first.
What is the most likely cause of 0x000000c8?
The most likely cause is a device driver or another lower-level program that changed IRQL for some period and did not restore the original IRQL at the end of that period. A routine that acquired a spin lock and failed to release it fits that pattern.
That IRQL detail narrows the diagnosis. It points to code running at kernel level, not to a generic Windows error screen. Until the dump names a module, do not assume a separate hardware problem or guess beyond the IRQL failure path in the analysis.
What to ignore until the dump supports it
Ignore guesses that are not backed by the dump. The useful evidence here is the bug-check name, the four parameters, and the module name, if one is listed. A clean record of those items beats a long list of guesses every time.
Fix the driver or low-level program named in the dump
Use the referenced module name, not a guess. If the dump points to a specific driver or lower-level program, work that component first. Keep the change narrow, then retest after each step so you know which action changed the crash pattern.
- Open Device Manager.
- Find the device that matches the named driver, or the closest matching component.
- Right-click it and choose Properties > Driver.
- If Roll Back Driver is available, use it.
- If rollback is unavailable, choose Uninstall device.
- Restart the PC.
- Retest the same workload that triggered the blue screen.
If the driver was changed recently, compare the crash timestamp with the most recent update entries before taking the next step. Preserve the dump first. Only then decide whether to remove the most recent update from Settings > Windows Update > Update history > Uninstall updates.
What if the first dump is vague?
If the first dump does not point to a clear module, keep it intact and capture a second dump before changing more parts. Then compare the two analyses. Matching parameters and the same module name usually mean the first dump was usable. Conflicting names mean the evidence needs a closer look.
Preserve the first dump before changing anything else
Copy the original dump file to a safe folder. Do not overwrite it. Save the WinDbg output too, including the bug-check name, the parameters, and the module name, if any. That gives you a before-and-after record when the second crash happens.
Capture a second dump and compare the two results
Run the same workload again and collect a second dump. Compare the bug-check parameters and the module name from both crashes. If they match, the named driver or lower-level program becomes the best place to focus. If they do not, keep the first dump and recheck the crash path from the start.
Check the crash timestamp against recent updates
Compare the first crash timestamp with the most recent update entries. If the timing lines up, that gives you a narrow window to inspect. Do not remove anything until the dump is preserved and the timestamps are written down.
Should you use the Microsoft bug check reference for this code?
Yes. The Microsoft bug check reference is the first lookup point because it maps the code to the bug-check name and links the code table. Use it to confirm that 0x000000c8 is IRQL_UNEXPECTED_VALUE, then use the dump analysis for the actual crash context.
- Look up
0x000000C8in the Microsoft bug check reference. - Confirm the name IRQL_UNEXPECTED_VALUE.
- Open the saved dump file in WinDbg.
- Run !analyze and record the parameters.
- Use the module name from the dump before making any repair choice.
What does 0x000000c8 IRQL unexpected value mean?
IRQL_UNEXPECTED_VALUE is the exact Microsoft name for 0x000000c8. The fix path starts with the dump, not with guesswork. The best next step is to capture the four parameters and the module name from WinDbg.
What should you do if 0x000000c8 appears on a laptop?
On a laptop, 0x000000c8 still points to the same bug check and the same evidence path. Start with the saved dump file, record the parameters, and follow the module named in the analysis. The device form factor does not change the decoding method.
What should you check if 0x000000c8 appears while a VPN is running?
Do not treat a VPN as the cause just because it was running when the blue screen appeared. The evidence still has to come from the dump. If WinDbg names a module tied to the crash, work that named component first and use the parameters to guide the next step.
What should you do if 0x000000c8 appears after an update?
If 0x000000c8 appears after an update, save the dump before removing anything. Then compare the crash timestamp with the update history. If the dump names a driver or lower-level program, use that module name first. Remove the update only after the evidence is preserved and the analysis supports that direction.
Still not working?
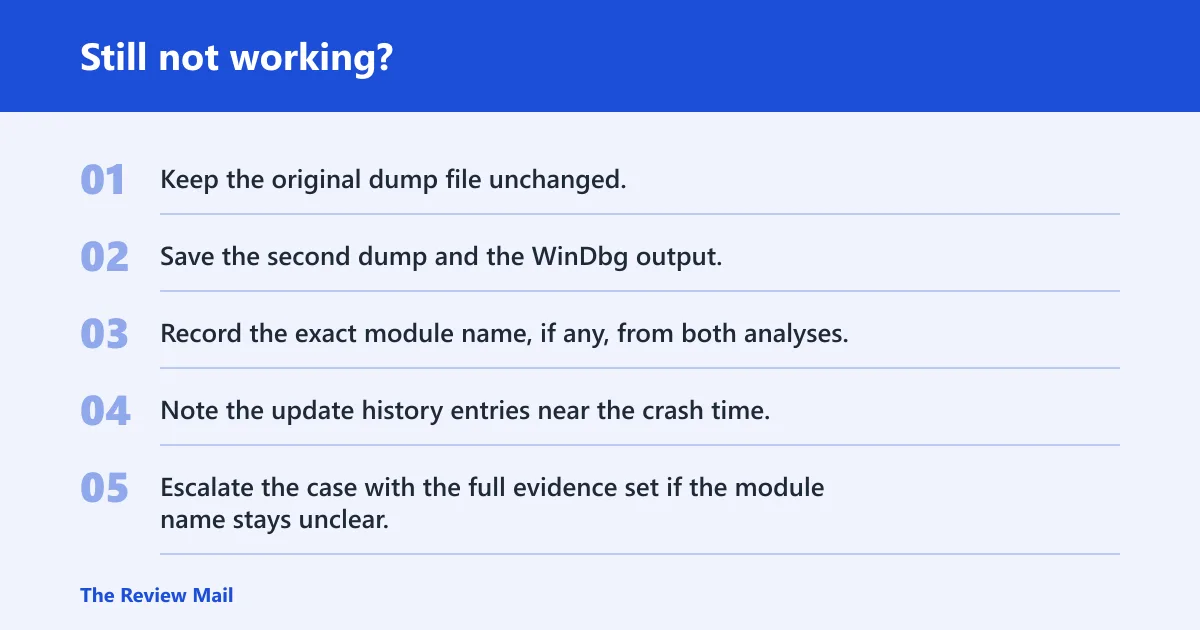
If the same stop code returns and WinDbg still does not give a clearer module name, stop changing parts. Keep the preserved dump, the second crash sample, the parameter set, and the timestamp record together. At that point, the case needs vendor or professional support with the full evidence packet.
If that didn’t work, try this next
- Keep the original dump file unchanged.
- Save the second dump and the WinDbg output.
- Record the exact module name, if any, from both analyses.
- Note the update history entries near the crash time.
- Escalate the case with the full evidence set if the module name stays unclear.
Prevention: after the issue is resolved, keep the latest working driver or low-level program version documented so the same IRQL-related crash can be traced faster if it returns.
Frequently asked questions
What does stop code 0x000000c8 mean in Windows?
It is IRQL_UNEXPECTED_VALUE. The processor’s IRQL is not what it should be at that time. The fastest next step is to save the dump, open it in WinDbg, and record the four parameters plus any module name before changing anything.
Is 0x000000c8 a driver problem or a hardware problem?
The Microsoft description points first to a device driver or another lower-level program that changed IRQL and did not restore it. Use the module name from WinDbg to decide what to inspect first. Do not jump to hardware replacement before the dump supports that move.
How do I check the bug check details for 0x000000c8 in WinDbg?
Open the saved dump file, run !analyze, and record the bug-check name, the four parameters, and any module name in the output. Microsoft says WinDbg can show a specific code with the -show syntax and can include stop code parameters.
What should I do first after a 0x000000c8 blue screen?
Take a photo of the stop screen if needed, then save the dump file and open it in WinDbg. The first useful record is the code, the parameters, the module name, and the timestamp. Fixing anything before that just removes evidence.
Can a dump file tell me which driver caused 0x000000c8?
Often, yes. The dump can contain the module name that WinDbg points to, and that is the best clue for the next step. If the first dump is vague, preserve it and capture a second one before changing more parts.
How is 0x000000c8 different from other BSOD stop codes like 0xA or 0x1A?
Each stop code points to a different bug-check name and different analysis path. For 0x000000c8, the key detail is the IRQL being not what it should be. Use the Microsoft reference to map the code first, then use the dump parameters to interpret the crash context.
What if 0x000000c8 keeps happening after a Windows update?
Preserve the dump first, then compare the crash timestamp with the most recent update entries. If the same module keeps appearing in WinDbg, focus on that component before considering any update removal. The order matters because the dump is the evidence source.
Should I use the Microsoft bug check reference for 0x000000c8?
Yes. Use it to confirm the code-to-name mapping, then move to WinDbg for the details. Microsoft’s reference is the lookup table; the dump analysis is the crash record. You need both to make a sound fix decision.