
0x0000011d: What It Means in Windows Stop Code Errors
0x0000011d is EVENT_TRACING_FATAL_ERROR. Treat it as a stop code to verify with the crash dump and the event log, because the number by itself does not explain which driver, device, or setting failed.
What 0x0000011d means in Windows
The code maps to a Windows event tracing fatal error, but the first job is still to confirm that the number came from a real bug check and not a photo of the wrong screen, a live dump message, or a copied hex value with missing digits.
Microsoft’s bug check code reference is aimed at programmers and includes a table of codes with links to more information. If 0x0000011d is absent from the usual stop-code lists people expect, that does not mean the machine is inventing a new failure; it usually means the next step is dump inspection, not guessing.
How to tell if you’re looking at a bug check, a live dump, or a typo
Check the exact text on the blue screen or in the log entry. A full bug check often shows a stop code and may leave a dump file. A live dump is different: it captures memory information and does not reset the operating system.
Copy the stop code, any parameters beside it, the build number, and whether the system rebooted after the crash. If the code came from a phone photo, check every digit again; 0x0000011d is easy to confuse with a nearby value.
Likely causes, ranked
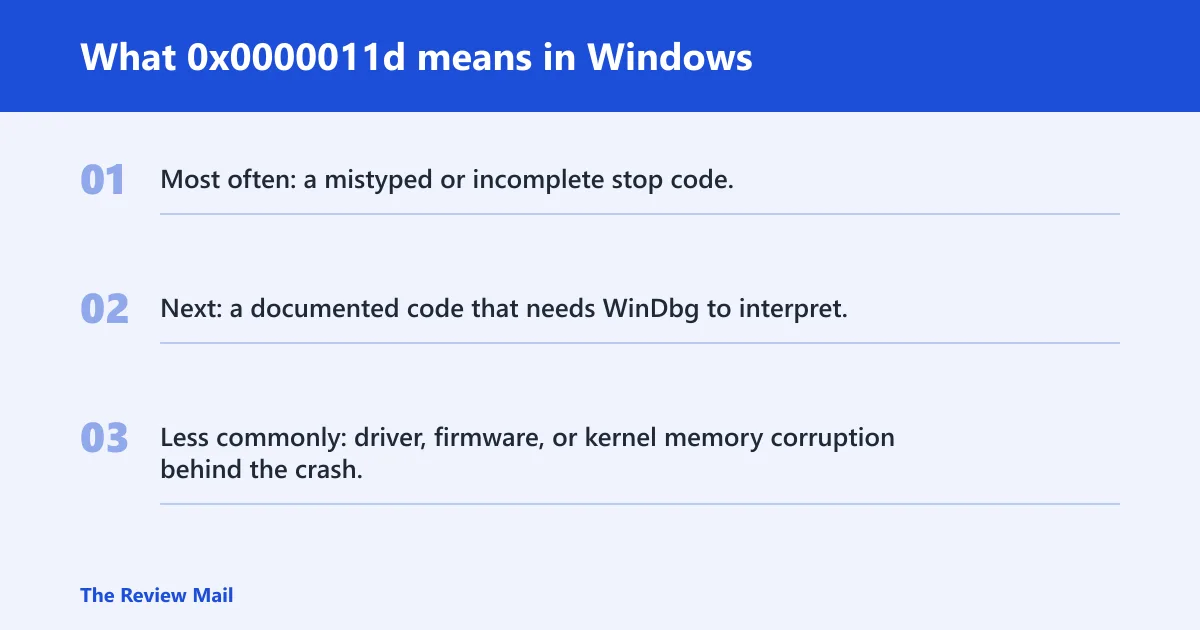
- Most often: a mistyped or incomplete stop code.
- Next: a documented code that needs WinDbg to interpret.
- Less commonly: driver, firmware, or kernel memory corruption behind the crash.
Can you verify 0x0000011d without debugging?
Yes. A non-debugging check can tell you whether the code is real, whether Windows wrote a dump, and which recent changes happened before the crash. That is usually enough to choose between a driver rollback, a firmware review, or WinDbg.
What to check first on the affected PC
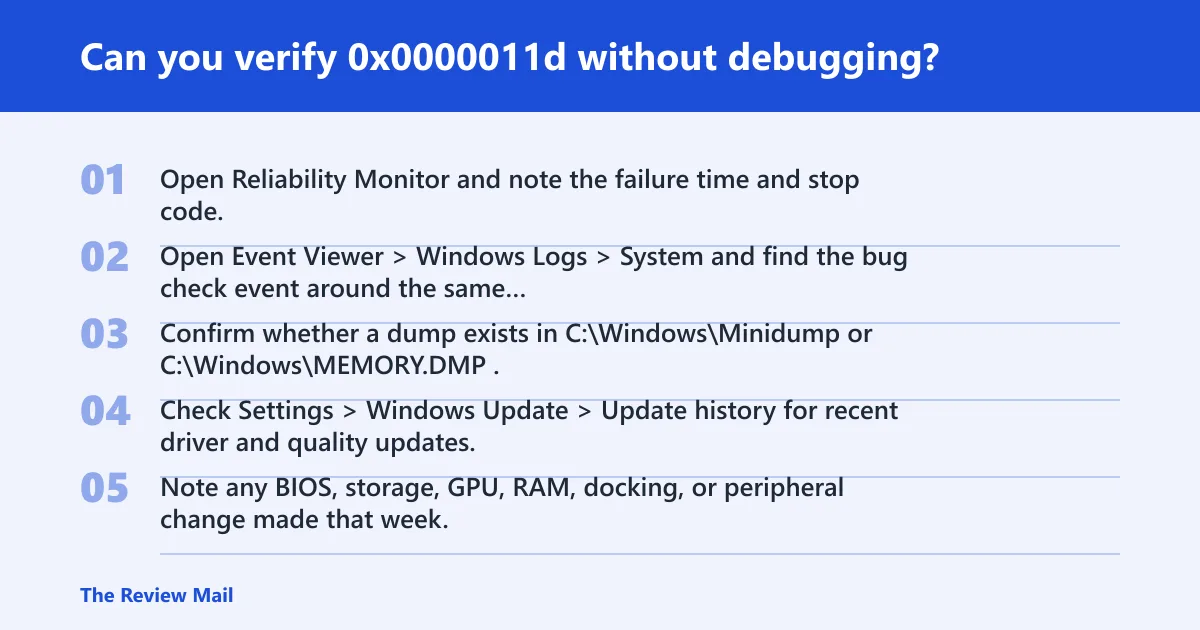
- Open Reliability Monitor and note the failure time and stop code.
- Open Event Viewer > Windows Logs > System and find the bug check event around the same time.
- Confirm whether a dump exists in
C:\Windows\MinidumporC:\Windows\MEMORY.DMP. - Check Settings > Windows Update > Update history for recent driver and quality updates.
- Note any BIOS, storage, GPU, RAM, docking, or peripheral change made that week.
What to collect for WinDbg
| What you can verify without debugging | What to collect for WinDbg |
|---|---|
| Exact stop code shown on the screen or in Event Viewer | The full dump file from C:\Windows\MEMORY.DMP or the latest file in C:\Windows\Minidump |
| Whether Windows rebooted, froze, or only logged an event | The complete blue screen text, including any parameters after 0x0000011d |
| Recent updates, driver changes, and new hardware | System build number, kernel version, and device list from Device Manager |
| Whether the system created a full crash dump or only a live dump | The dump path and timestamp, plus the exact failure time |
Bug check dump files may be available after a crash, and they contain more information about memory contents at failure time; using them well requires kernel debugging knowledge.
How do I look up a Windows stop code in WinDbg?
Use WinDbg’s !analyze extension. Microsoft recommends the syntax !analyze -show <code>, and if the default radix is not 16, prefix the code with 0x. That lets you inspect a stop code without guessing from the name alone. (Microsoft Learn)
Basic command pattern
- Get WinDbg from Microsoft’s download information page and install it.
- Open WinDbg with administrator rights.
- Load the dump file.
- Run !analyze -show
0x0000011d. - Read the bug check name, the faulting module, and the parameter block.
How to pass stop code parameters
Microsoft shows parameterized analysis with !analyze -show 0x9F 0x3, where the example bug check is DRIVER_POWER_STATE_FAILURE (9f). If your screen shows parameters after 0x0000011d, include them exactly as displayed. That can change the result.
How to read the result without guessing
Look for three things: the bug check name, the probable failing component, and whether the crash points at a driver, storage path, firmware layer, or memory corruption. If WinDbg only returns a generic result, go back to the dump file and the recent-change list rather than forcing a conclusion.
Is 0x0000011d a hardware or driver problem?
It can be either, and sometimes neither on the first pass. For a code like this, the practical test is whether the dump points to a specific driver stack, whether recent firmware or BIOS changes line up with the crash, or whether the machine shows broader memory or storage errors.
If that didn’t work, try this next: driver rollback or removal
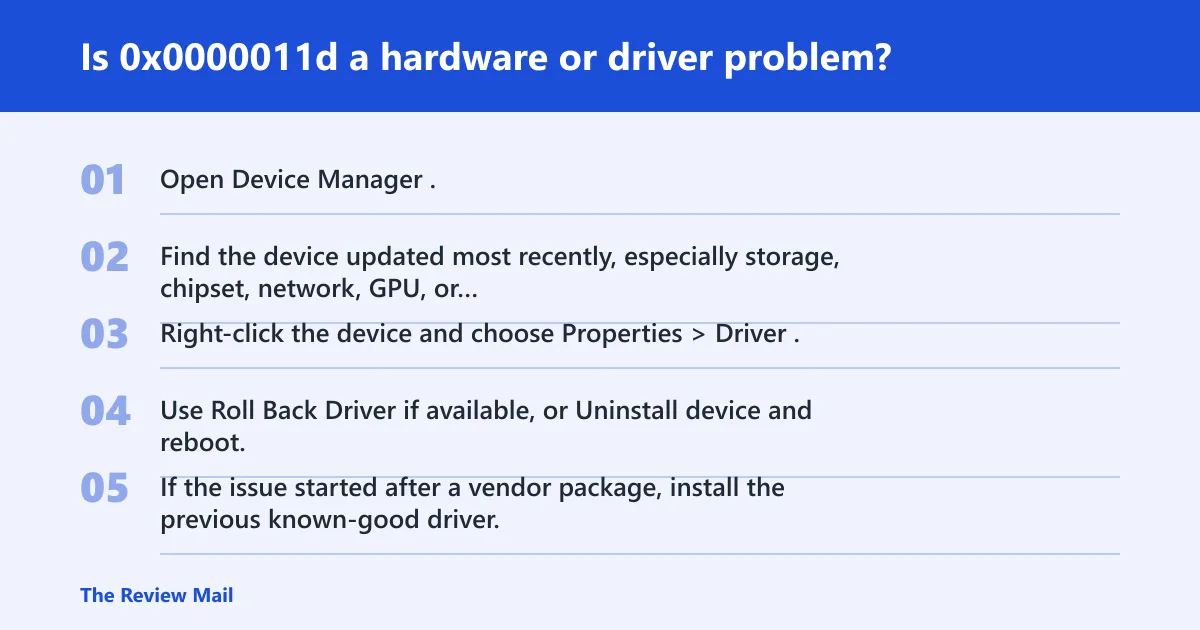
- Open Device Manager.
- Find the device updated most recently, especially storage, chipset, network, GPU, or tracing-related devices.
- Right-click the device and choose Properties > Driver.
- Use Roll Back Driver if available, or Uninstall device and reboot.
- If the issue started after a vendor package, install the previous known-good driver.
If that didn’t work, try this next: remove recent firmware or hardware changes
- Enter BIOS or UEFI setup and note any recent option changes.
- Return tracing, storage, memory, or overclock settings to default.
- Disconnect new peripherals, docks, or expansion hardware.
- Test again before adding components back one at a time.
If that didn’t work, try this next: memory and disk checks
- Run Windows Memory Diagnostic from the Start menu, or use memtest86 for a deeper pass.
- Open an elevated Command Prompt and run
chkdsk /scan. - If Windows reports file corruption, run
sfc /scannow. - Then run
DISM /Online /Cleanup-Image /RestoreHealth.
Prevention: keep chipset, storage, and firmware changes documented. When a crash starts after one update, that record is often the shortest path to the bad component.
What should I do after a blue screen with an unknown bug check code?
Start with the screenshot, the Event Viewer entry, and any dump file Windows created. Then separate user-safe checks from debugger-only work. If you cannot confirm the code from a dump or a log, do not assume the first driver you see is the culprit.
Use Microsoft’s customer and IT guidance in the right order
- For a personal PC, open Microsoft’s Resolving Blue Screen errors in Windows guidance first.
- For managed systems, move to Advanced troubleshooting for stop code errors.
- If the crash points to a named component, follow the vendor’s rollback or update path.
- If the dump suggests kernel-mode analysis, continue in WinDbg.
When to switch from basic triage to deeper analysis
If the same stop code repeats after a driver rollback, or if the dump references a specific module, the next step is kernel debugging or vendor support. That is especially true when the code is not listed in the main bug check article but the dump clearly names a component.
What if my stop code is not listed in the bug check reference?
If a stop code is missing from the main bug check article, do not treat that as proof the machine is fine. It may be a live dump code, a typo, a parameterized case, or a value that needs a dump file to interpret correctly. The safest move is to validate the source first.
Check whether it belongs to a different reference
Live dump stop codes are covered in a separate Kernel live dump code reference, and Microsoft says they are not listed in the main bug check article. That difference matters because live dumps preserve the running system instead of forcing a reset.
Decide what kind of file you have
- If the system rebooted, check for
C:\Windows\MEMORY.DMPorC:\Windows\Minidump. - If Windows stayed up, look for live dump artifacts and the live-dump reference entry.
- If the code was copied from a report, recheck the digits and any attached parameters.
- Then run !analyze -show <code> against the correct file type.
Do live dump stop codes reset Windows?
No. Live dump stop codes do not reset the operating system, and Microsoft keeps them out of the main bug check article. That makes them useful for collecting memory data on a running system, but it also means the investigation path is different from a classic blue screen.
How to handle a live dump case
- Do not power off the machine unless the live dump process stalls.
- Collect the live dump file and timestamp.
- Match the event to the system activity that triggered it.
- Use the kernel live dump reference before you chase standard BSOD steps.
Frequently asked questions
What does 0x0000011d mean in Windows?
It maps to EVENT_TRACING_FATAL_ERROR. Confirm that it came from a real bug check event, then use !analyze -show 0x0000011d on the matching dump file. If no dump exists, collect the exact screen text and the Event Viewer record first.
Is 0x0000011d a hardware or driver problem?
It can point to either one. Start with the newest driver, recent firmware changes, and any new hardware. If rollback does not help, run Windows Memory Diagnostic and chkdsk /scan, then inspect the dump for a named module.
How do I look up a Windows stop code in WinDbg?
Open the dump in WinDbg and run !analyze -show <code>. If the code has parameters, include them exactly, as in !analyze -show 0x9F 0x3. If the default radix is not 16, prefix the code with 0x.
What should I do after a blue screen with an unknown bug check code?
Check Event Viewer, Reliability Monitor, and C:\Windows\MEMORY.DMP or C:\Windows\Minidump. Then review recent driver, firmware, and hardware changes. If the stop code still does not map cleanly, use Microsoft’s blue-screen guidance or the IT troubleshooting guide.
Can I find the failing driver from a crash dump?
Often, yes. Load the dump in WinDbg and look for the faulting module or stack frame. If the analysis names a driver, update it, roll it back, or uninstall it in Device Manager before changing anything broader.
Where is the official Microsoft list of bug check codes?
It is in Microsoft’s bug check code reference. The reference includes a table of codes and links to more information, and Microsoft notes that it is intended for programmers. For live dump cases, use the separate kernel live dump reference.