
0x0000014b: What It Means and How to Fix It Fast Now
0x0000014b is a Windows bug check I treat as a fact-finding job: collect the crash dump, Event Viewer entries, recent driver and hardware changes, then decide whether the fault points to a driver, storage, memory, or firmware path. Skip the evidence and you burn time, lose rollback options, and miss a failing part. This guide shows what to gather first, how to read the clues, and when WinDbg analysis or vendor escalation is the next move.
What does stop code 0x0000014b mean in Windows?
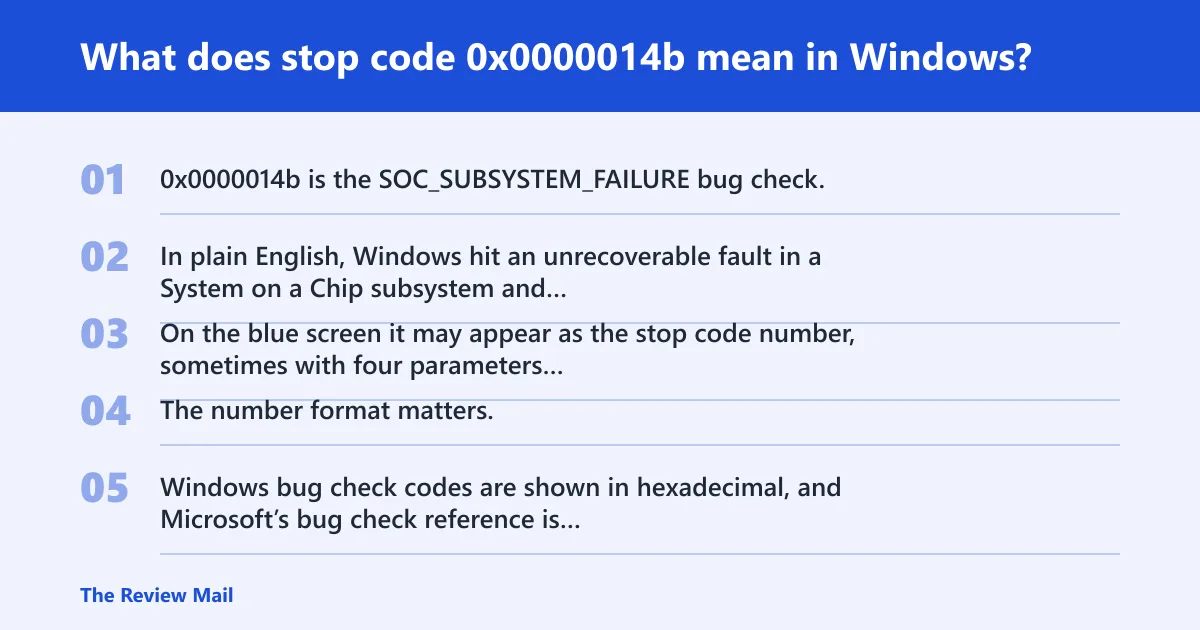
0x0000014b is the SOC_SUBSYSTEM_FAILURE bug check. In plain English, Windows hit an unrecoverable fault in a System on a Chip subsystem and stopped to avoid further damage. On the blue screen it may appear as the stop code number, sometimes with four parameters that help narrow the cause.
The number format matters. Windows bug check codes are shown in hexadecimal, and Microsoft’s bug check reference is aimed at programmers, not end users. It is a lookup table for code names, nearby stop codes, and parameter notes. Microsoft also points customers to a separate blue-screen troubleshooting article, while IT professionals get an advanced debugging article.
The code by itself does not name the broken part. It tells you to move into dump analysis and change tracking, because the same stop screen can follow a bad driver, a storage fault, memory corruption, or a board-level problem. A kernel live dump is different: it captures memory information during an abnormal event without resetting Windows, and live dump entries are not part of the stop-code table.
Why the code alone is not enough
Use the stop code as a starting point, not a diagnosis. The useful evidence lives in the dump, the parameters, and whether the crash repeats under the same conditions.
Microsoft’s debugger can display stop code information with !analyze, and the syntax shown is !analyze -show <code>. If the radix is not hex, prefix the code with 0x. That matters when comparing 0x0000014b with nearby entries such as 0x0000000A and 0x0000001A in the reference table.
What should I check first after a 0x0000014b crash?
Start by confirming whether the crash repeats, then look for a bug check dump file, and then note any recent driver, firmware, storage, or hardware change. If it happened once after a new update, that points somewhere different than a system that fails on every boot or during the same workload.
Fastest first pass
- Write down the exact stop code and all four parameters shown on the screen.
- Open Settings > Update & Security > View update history on Windows 10, or Settings > Windows Update > Update history on Windows 11.
- Check whether the crash followed a driver, BIOS, storage, or dock change.
- Look for a dump file before making changes that could remove evidence.
How to check whether a dump exists
Bug check dump files may be available after a crash. If present, they often contain more information about memory contents at the moment of the stop code. Common places to check are C:\Windows\Minidump and C:\Windows\MEMORY.DMP. If neither exists, note that clearly before trying repairs.
Likely causes, ranked from most to least common
The most useful ranking comes from evidence, not the stop code alone. In practice, a recent driver or filter change is often the first thing to test, followed by storage faults, then memory corruption, and finally firmware or board-level instability. The same code can appear on very different machines for different reasons.
| Evidence pattern | Likely cause | First test | Escalation path |
|---|---|---|---|
| Dump present, recent driver change, repeatable crash | Driver or filter driver | Roll back or remove the last driver | WinDbg analysis, vendor driver update |
| No dump, storage symptoms, crash on file access | Storage or file-system fault | chkdsk, cable/controller check | Disk vendor diagnostics, board support |
| Dump present, random crashes, unrelated workloads | Memory corruption | Windows Memory Diagnostic or memtest86 | RAM reseat, module replacement |
| Crash after BIOS, firmware, or power-state change | Firmware or board-level instability | Revert firmware change, load defaults | System board or device vendor support |
Is 0x0000014b a driver problem or hardware problem?
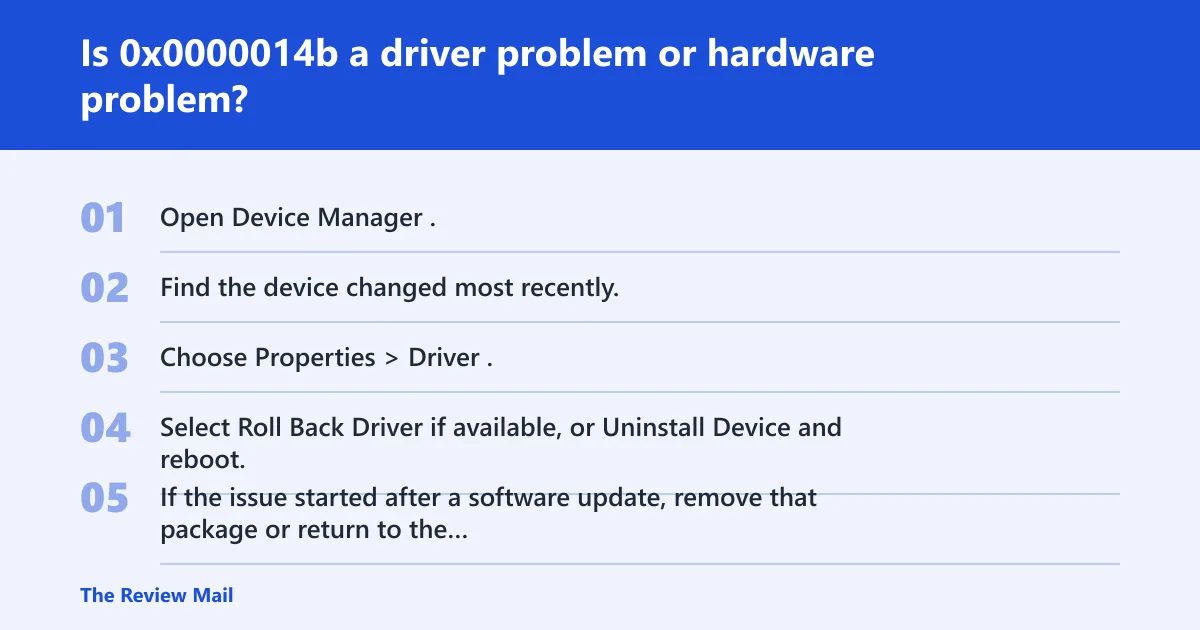
It can be either. A recent driver change, especially for storage, antivirus, virtual devices, or chipset-adjacent software, points toward a driver path. Repeated crashes under the same disk activity point more toward storage. Random failures across tasks, or crashes that survive driver rollback, push the diagnosis toward memory or firmware.
Driver path: what points that way
- Open Device Manager.
- Find the device changed most recently.
- Choose Properties > Driver.
- Select Roll Back Driver if available, or Uninstall Device and reboot.
- If the issue started after a software update, remove that package or return to the earlier version.
Storage path: what points that way
- Open an elevated Command Prompt.
- Run
chkdskC: /f. - Check SATA, NVMe, or USB enclosure cabling and reseat the device if possible.
- Review whether the crash appears during installs, file copies, sleep, or resume.
Memory path: what points that way
- Run Windows Memory Diagnostic from the Start menu.
- For deeper testing, run memtest86 from boot media.
- Test one memory module at a time if the system allows it.
- If failures repeat on the same slot or module, stop using that part.
Firmware path: what points that way
- Enter BIOS or UEFI setup.
- Load default settings if a recent tuning change was made.
- Undo recent firmware updates only if the vendor recommends that path.
- If the crash began after a platform update, open a support case with the system maker.
How do I tell 0x0000014b apart from other memory-related BSODs?
Use the stop code name, the crash pattern, and the parameters together. 0x0000014b is a SoC subsystem failure, while 0x0000000A is IRQL_NOT_LESS_OR_EQUAL and 0x0000001A is MEMORY_MANAGEMENT. Those neighboring codes can look similar on a blue screen, but they point you into different branches of investigation. (Microsoft Learn)
What the neighboring codes suggest
IRQL_NOT_LESS_OR_EQUAL often tracks to a bad driver touching invalid memory at the wrong interrupt level. MEMORY_MANAGEMENT often points toward memory corruption, paging issues, or unstable RAM. 0x0000014b sits beside them in the reference table, but it is not the same kind of stop and should not be treated as interchangeable.
How parameters narrow the diagnosis
STOP code parameters Arg1 through Arg4 can narrow the search. In WinDbg, !analyze -show <code> and parameter inspection help identify whether the fault aligns with a device object, a path through storage, or a memory state at the moment of failure. The parameters do not replace the dump; they guide it.
How do I use WinDbg and the Microsoft reference table?
WinDbg can identify the cause of 0x0000014b if a dump file exists and the analysis has enough context. Open the dump in Windows Debugger, run !analyze -show <code> in kernel mode, and inspect Arg1 through Arg4. Then use the official Windows bug check code reference to compare related codes and nearby stop conditions.
What WinDbg can and cannot tell you
WinDbg is useful when the dump captures the failing state. It can display stop code information and help point at the device, module, or subsystem involved. It cannot invent a dump that does not exist, and it cannot prove a part is bad without matching the analysis to repeatable symptoms.
Worked example of the workflow
- Open the dump in Windows Debugger.
- Run !analyze -show 0x14b.
- Read the stop code name and the four arguments.
- Check whether the failing path mentions storage, a driver module, or a subsystem boundary.
- Map that result to the next action: rollback, disk test, memory test, or vendor escalation.
0x0000014b triage matrix
This matrix is meant to fit on one page during support triage. It separates the evidence that points to software from the evidence that points to storage, memory, or firmware. Use it before making changes that erase the clue trail.
| Dump present | Recent driver change | Storage symptoms | Repeatability | Likely cause | First test | Escalation path |
|---|---|---|---|---|---|---|
| Yes | Yes | No | Same task repeats crash | Driver or filter driver | Rollback or uninstall the last driver | WinDbg review, vendor driver package |
| No | No | Yes | Crash during file access | Disk, cable, or controller | chkdsk and hardware check | Disk vendor diagnostics |
| Yes | No | No | Random | Memory corruption | Windows Memory Diagnostic | memtest86, RAM swap test |
| Yes or no | Firmware or BIOS change | No | After sleep, resume, or power event | Firmware or board-level instability | Revert the setting or load defaults | System vendor support |
What information should I collect before asking for help with 0x0000014b?
Collect the exact stop code and all four parameters, any dump file or a note that none exists, recent driver or firmware changes, and whether storage, memory, or reboot patterns repeat. That set lets support sort the crash into the right branch quickly instead of starting from zero.
Minimum escalation checklist
- Exact screen text, including
0x0000014b. - Arg1 through Arg4 from the bug check screen or dump analysis.
C:\Windows\Minidumpfiles orC:\Windows\MEMORY.DMP.- Recent driver, firmware, BIOS, SSD, RAM, dock, or adapter changes.
- Any storage errors, failed boots, sleep-resume crashes, or repeat triggers.
Prevention: keep a short change log for drivers, firmware, and hardware swaps. It makes the next crash easier to sort, and it reduces the odds of undoing the wrong change first.
Still not working?
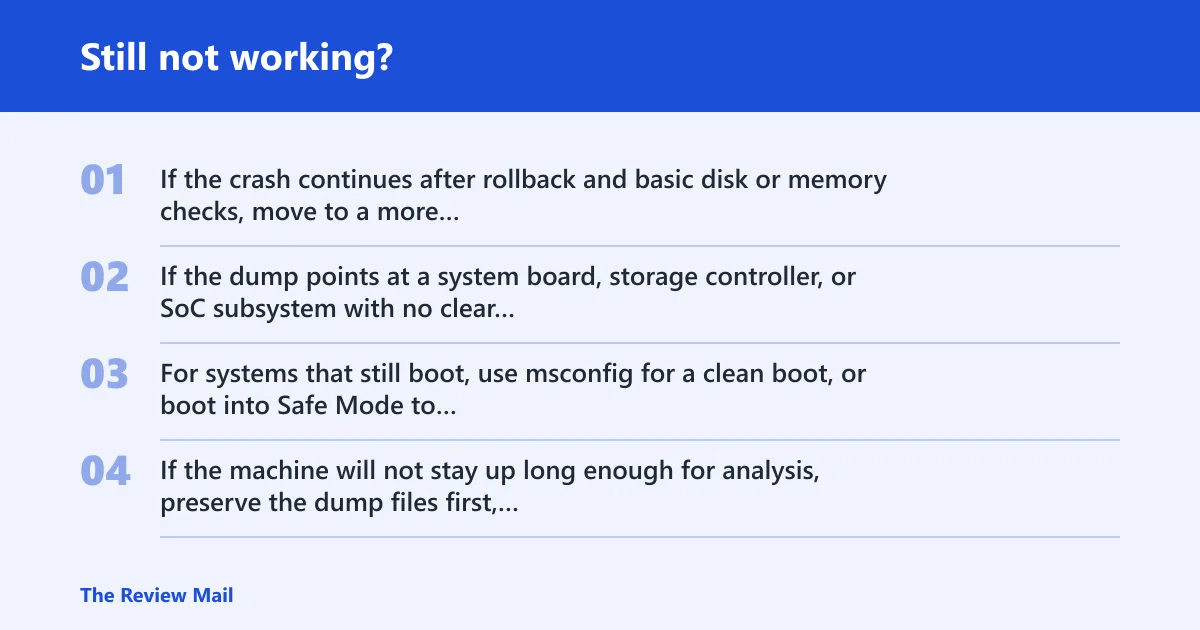
If the crash continues after rollback and basic disk or memory checks, move to a more invasive test path: Safe Mode, a clean boot, or a full vendor diagnostic. If the dump points at a system board, storage controller, or SoC subsystem with no clear software trigger, stop cycling fixes and escalate to the device maker or a repair shop.
For systems that still boot, use msconfig for a clean boot, or boot into Safe Mode to narrow the trigger set. If the machine will not stay up long enough for analysis, preserve the dump files first, then work from the evidence rather than from guesses.
Frequently asked questions
What does stop code 0x0000014b mean in Windows?
It means Windows hit a SoC subsystem failure and stopped. The next move is to collect the dump, the four bug check parameters, and the last hardware or driver change before trying repairs.
Is 0x0000014b a driver problem or hardware problem?
Either path is possible. A recent driver install or rollback opportunity points at software first; repeated crashes with disk or memory symptoms point more toward hardware, storage, or firmware.
What should I do first when I get a BSOD with 0x0000014b?
Write down the stop code, save the parameters, and check for C:\Windows\Minidump or C:\Windows\MEMORY.DMP. Then look at the last driver, BIOS, or storage change before you make any repair.
How do I check whether a crash dump exists for 0x0000014b?
Open File Explorer and look in C:\Windows\Minidump; also check for C:\Windows\MEMORY.DMP. If nothing is there, record that absence and move on to repeatability and change history.
Can WinDbg identify the cause of stop code 0x0000014b?
Yes, if a dump exists and the analysis has kernel-mode context. Open the dump in Windows Debugger, run !analyze -show 0x14b, and inspect the four arguments for clues about the failing subsystem.
Which drivers or devices most often trigger 0x0000014b?
Storage controllers, third-party filter drivers, antivirus components, virtual device layers, and chipset-adjacent packages are the first suspects. Remove the last change first, because that is the fastest way to separate a bad install from a deeper fault.
How do I tell 0x0000014b apart from other memory-related BSODs?
Compare the stop name and the pattern. 0x0000000A is IRQL_NOT_LESS_OR_EQUAL, and 0x0000001A is MEMORY_MANAGEMENT. If the crash repeats during the same driver path, the code may be driver-led; if it repeats anywhere, memory or firmware moves up the list.