0x0000012f BSOD: Causes, Triage, and Fixes for Windows
0x0000012f is a Windows BSOD you should triage by crash context first. Check the dump, Event Viewer, and any recent driver or hardware change before you change anything else. That order cuts down wasted work and keeps you from chasing the wrong subsystem. This guide shows how to identify the crash context, map the stop code to the likely fault domain, and choose the next diagnostic step.
This guide is part of our Windows BSOD stop codes: full list and fixes series.
What does 0x0000012f mean, and what should you capture first?
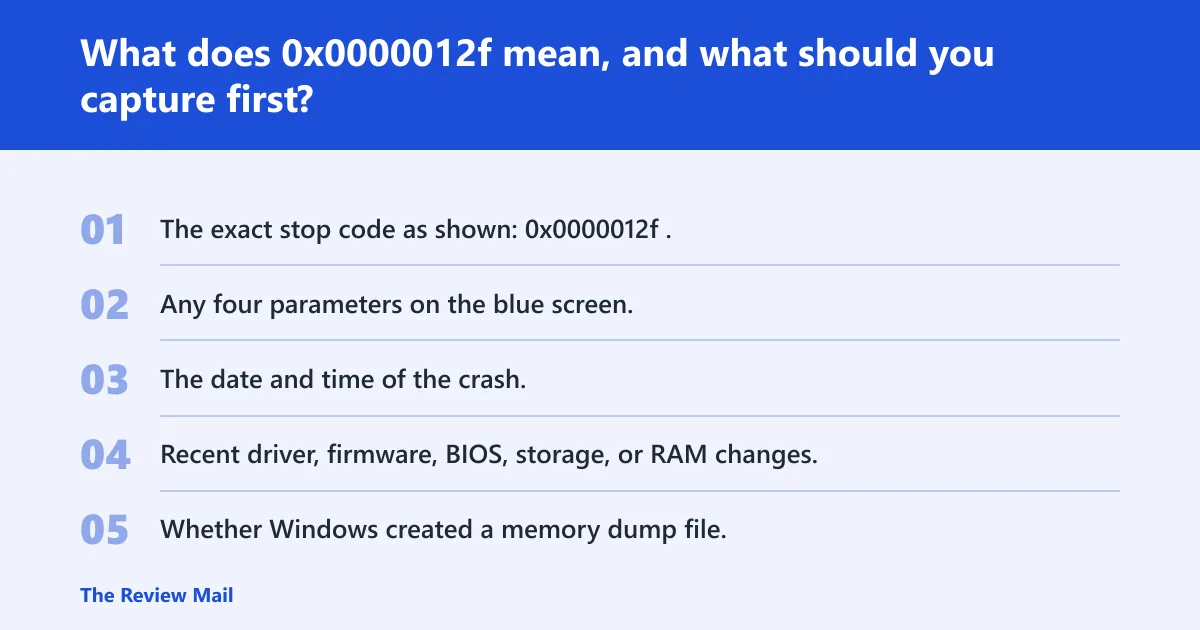
Record the crash details before you touch settings or parts. Write down the exact hexadecimal code, any stop-code parameters on the blue screen, the minidump path if Windows saved one, and the Event Viewer entry near the crash time. Those records tell you whether to start with boot, storage, memory, or driver analysis.
What to note right away
- The exact stop code as shown:
0x0000012f. - Any four parameters on the blue screen.
- The date and time of the crash.
- Recent driver, firmware, BIOS, storage, or RAM changes.
- Whether Windows created a memory dump file.
How to collect the first artifacts
- Open Event Viewer and check Windows Logs > System for a critical error at the crash time.
- Look in
C:\Windows\Minidumpfor a recent dump file. - Check Reliability Monitor for a matching blue-screen event.
- Write down any recent hardware, driver, BIOS, or VHD-related changes.
What are the most likely causes of 0x0000012f?
Start with the evidence, not guesses. 0x0000012F is typically associated with a VHD boot initialization failure, and parameter 1 may indicate different boot-stage failures. If there is no useful dump, the odds move toward boot-time or storage-path problems.
Likely causes to rank first
- VHD boot initialization failure tied to the boot path or mounted VHD.
- Storage or controller trouble that blocks the VHD parent device from surfacing.
- Driver or filter-stack interference during boot.
- Memory allocation or firmware issues during early startup.
- An incomplete crash record that hides the real trigger.
Say your system only crashes after a recent boot configuration change and the dump points to the boot path. That puts VHD initialization and storage access ahead of RAM. Suppose the crash appears after a BIOS update and only on cold boot. That points you toward firmware or boot timing.
One-page triage table for 0x0000012f
Use this table to narrow the first diagnostic move. Match the symptom pattern to the artifact you already have, then follow the next tool in the chain. That is faster than changing drivers blindly or replacing hardware before you know which subsystem failed.
| Symptom pattern | Likely subsystem | First check | Next tool |
|---|---|---|---|
| Crash during boot, especially on a VHD-backed install | Boot/VHD initialization | Boot configuration and recent VHD path changes | WinDbg !analyze on the dump file |
| Crash follows storage reset, timeout, or I/O errors in logs | Storage or controller | System log entries around the crash time | Vendor storage diagnostics or chkdsk |
| Crash repeats after driver install or rollback | Driver or filter stack | Recent Device Manager changes | Safe Mode or clean boot |
| Crash appears under load or after a BIOS/UEFI change | Memory or firmware | RAM settings, XMP, firmware version | Windows Memory Diagnostic or memtest86 |
| No minidump, but Event Viewer shows a kernel crash | Evidence gap | Dump settings and Reliability Monitor | Enable small memory dumps, then wait for the next crash |
How do I use WinDbg to analyze bug check 0x0000012f?
Open the dump in WinDbg, load the kernel-mode crash data, and run !analyze. Microsoft recommends that extension for bug check information, and WinDbg can also show a specific stop code with !analyze -show. If the tool exposes parameter values, include them in your analysis. (Microsoft Learn)
Basic WinDbg workflow
- Install WinDbg and open the latest file from
C:\Windows\Minidumpor the full memory dump. - Run !analyze -show
0x0000012fto view the stop code mapping. - Run !analyze to inspect the stack, faulting module, and parameter values.
- Check whether the output names a boot, storage, or driver component.
What the parameters can tell you
Parameter 1 often separates one failure path from another. For this stop code, the listed causes can include boot-device extraction failure, parent-device timeout, allocation issues, path-construction problems, mount failure, and sleep-state disable failure. Parameter 2 is often an NT status code. Parameters 3 and 4 are usually reserved.
Could storage or controller faults be behind 0x0000012f?
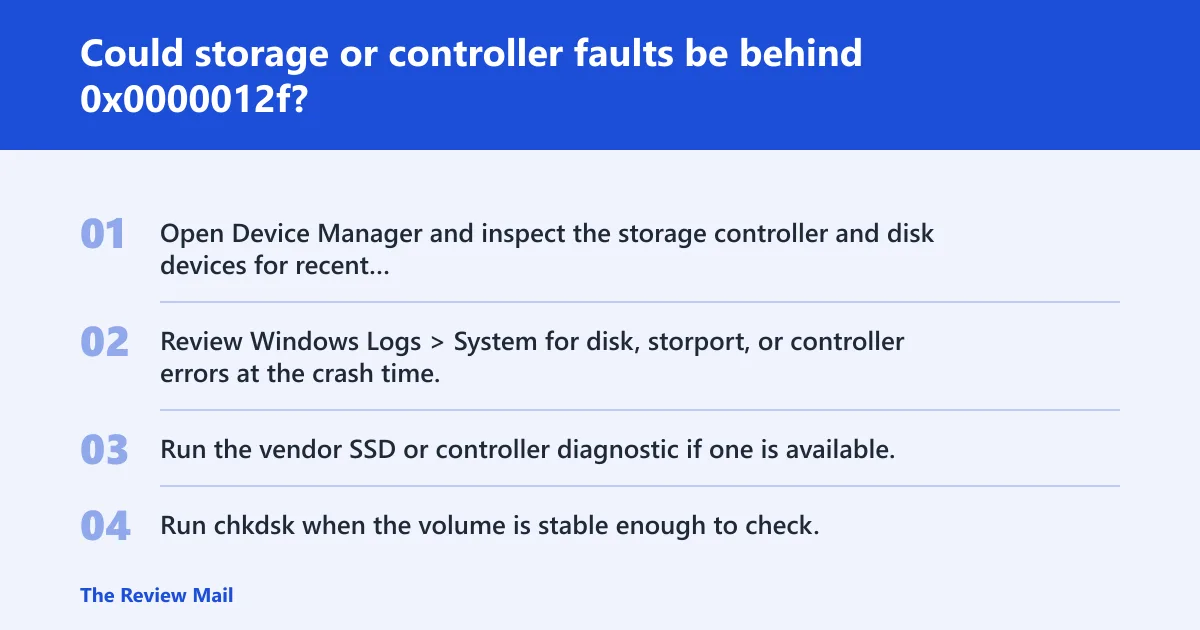
Yes, especially when the machine stalls during boot or logs show reset and timeout activity near the crash. A storage path problem can block access to the boot VHD or the parent device that must appear first. Check the disk, SSD firmware, controller driver, and cabling before you replace the drive.
First checks for storage path trouble
- Open Device Manager and inspect the storage controller and disk devices for recent changes.
- Review Windows Logs > System for disk, storport, or controller errors at the crash time.
- Run the vendor SSD or controller diagnostic if one is available.
- Run
chkdskwhen the volume is stable enough to check.
When storage becomes the leading suspect
Look harder at storage when the crash happens at the same stage of boot, especially after sleep or hibernation changes. If a SATA or NVMe controller reset appears in the logs, that gives you more to work with than a broad “disk issue” guess. A missing dump file also makes early boot storage faults more likely.
Could memory or firmware issues be the trigger?
They can be, but they move up the list only when the crash lines up with load, boot timing, or recent firmware and RAM setting changes. Early boot failures can come from allocation problems or unstable memory settings. Treat RAM and firmware as candidates, not conclusions.
Checks for memory and firmware
- Open Windows Memory Diagnostic or boot memtest86 from external media.
- Enter BIOS or UEFI setup and note any XMP or memory overclock setting.
- Check whether the system started failing after a firmware update.
- Return custom memory settings to default if the crash began after tuning.
When hardware replacement becomes more likely
Replacement becomes more likely after repeatable errors from memory diagnostics, repeated storage timeouts on a known-good install, or the same boot failure across a clean software image. A single blue screen is not enough. Repeated failures with the same artifact pattern are.
How do I check for a driver or filter-stack problem?
Use Safe Mode or a clean boot to see whether the crash repeats without third-party drivers and services. If it stops, roll back or remove the most recent driver change first. Then open the dump in WinDbg and confirm whether the stack points to a filter, boot driver, or related module.
Driver-first triage steps
- Boot into Safe Mode and see whether the crash still appears.
- Use Device Manager to roll back, update, or uninstall the most recent driver changes.
- Perform a clean boot via msconfig if Safe Mode is stable.
- Return to the dump file in WinDbg and compare the module name with the change you made.
Why this path matters
A filter driver can interfere with boot storage, especially when a VHD is involved. That does not mean every crash is a driver bug. It means driver isolation is a fast way to rule the path in or out before you touch firmware or replace hardware.
What Windows logs or tools help with BSOD stop codes?
Use Event Viewer, Reliability Monitor, and any saved minidump files together. Those artifacts give you crash timing, error type, and the data WinDbg needs. Microsoft also separates quick user checks from deeper IT troubleshooting, so keep the fast checks apart from dump analysis.
Useful tools and records
- Event Viewer for the crash timestamp and companion warnings.
- Reliability Monitor for repeated crash patterns.
C:\Windows\Minidumpfor small dump files.- WinDbg for kernel-mode dump inspection.
- Recent BIOS, storage, and driver change logs from your change history.
What should I do first after a 0x0000012f BSOD?
Capture the crash record, then decide whether the system still boots. If it boots, export the logs and inspect the dump. If it does not boot, use Safe Mode or recovery media before making changes. The fastest useful first step is evidence collection, not repair.
If that didn’t work, try this next
- Copy the minidump file and the Event Viewer record.
- Run WinDbg !analyze on the dump.
- Check Device Manager for the newest driver changes.
- Test storage or memory only if the crash evidence points there.
How do I fix stop code 0x0000012f?
The fix depends on the crash context, but the first practical order is: inspect the dump, isolate the boot path, then test the most likely subsystem. For a VHD boot failure, that often means storage or boot configuration first, driver isolation second, and firmware or RAM only when the evidence supports it.
Fix order by evidence
- Open the dump in WinDbg and confirm the faulting path.
- Check the boot and storage logs for reset or timeout errors.
- Use Safe Mode or clean boot to separate driver problems from boot-path problems.
- Run the relevant diagnostic:
chkdsk, Windows Memory Diagnostic, or vendor storage tools.
Does 0x0000012f mean my PC is failing hardware?
Not automatically. It can point to hardware, but it can also come from boot configuration, storage drivers, or a bad VHD path. Treat hardware failure as a stronger possibility only after repeated crashes, repeatable diagnostics, and a dump or log pattern that points the same way each time.
When to suspect replacement
- Memory tests report repeatable errors.
- Storage diagnostics show unrecoverable faults.
- The same crash follows known-good software installs.
- The error persists after driver rollback and firmware review.
Does 0x0000012f VHD boot initialization failed loop happen in Safe Mode?
If the blue screen still appears in Safe Mode, the problem is less likely to be a normal third-party app and more likely to be in the boot path, storage stack, or firmware. If Safe Mode works, focus on the most recent driver, filter, or boot-related change before touching hardware.
Safe Mode decision path
- Boot to Safe Mode.
- If it boots, remove or roll back the newest driver changes.
- If it still fails, inspect storage logs and the dump file.
- If there is no usable dump, collect a new one after the next crash.
What should I do for a 0x0000012f Dell system?
Use the same triage process on a Dell system, then add vendor diagnostics and BIOS review. Model-specific firmware, storage controller settings, and memory profiles can matter more than brand name. If Dell support tools show a hardware fault, that evidence is more useful than a generic reset.
Dell-specific checkpoints
- Open BIOS or UEFI and note any storage or memory profile changes.
- Run the vendor hardware diagnostics from the Dell support environment if available.
- Check the boot configuration if the system uses a VHD or recovery image.
- Compare the diagnostics with the dump file before replacing parts.
Frequently asked questions
What does 0x0000012f mean on a blue screen?
It is a hexadecimal bug check code that maps to a VHD boot initialization failure. The practical next step is to capture the dump, event log, and any stop-code parameters so WinDbg can separate a boot-path failure from storage, driver, or firmware trouble.
How do I use WinDbg to analyze bug check 0x0000012f?
Open the dump file, run !analyze -show 0x0000012f, then run !analyze for stack and module details. If the output includes parameter values, keep them with the crash record. That combination usually points to the failing subsystem.
Can a dump file tell me why 0x0000012f happened?
Often, yes. A memory dump contains extra information about memory at crash time, and Microsoft notes that crash dumps may be available after a bug check. If no dump exists, rely on Event Viewer, Reliability Monitor, and boot-related logs until another crash creates one.
Is 0x0000012f a driver, disk, or memory problem?
It can be any of those, but the code alone does not prove one. Start with the crash context: boot stage, recent changes, log errors, and dump output. Then test the most likely subsystem first, which is usually the boot or storage path on a VHD-based failure.
What Windows logs or tools help with BSOD stop codes?
Use Event Viewer, Reliability Monitor, and any minidump files from C:\Windows\Minidump. For deeper analysis, use WinDbg in kernel mode. Microsoft’s bug check listings also provide stop-code names and reference links, which helps when you need code-to-name mapping before acting.
Does 0x0000012f mean my PC is failing hardware?
Not by itself. Hardware becomes a stronger suspect only after repeatable memory or storage diagnostics, or when the same stop code returns after driver rollback and firmware review. If the system still boots, that evidence usually arrives faster than guessing at replacement parts.