0x0000010e BSOD: What It Means and How to Fix It Fast
0x0000010e often points to a display-subsystem fault, so it can help to separate GPU driver issues, GPU hardware instability, and a kernel video-path problem before trying general Windows fixes. Skip that split and you can waste hours, trap the PC in repeated startup crashes, and chase the wrong repair. This guide maps the code to the failing layer and then gives the right fix path for Windows users, gamers, and IT troubleshooters.
The fastest first move is to record the exact trigger, preserve any dump file, and check whether the system still boots.
What does 0x0000010e mean on a blue screen?
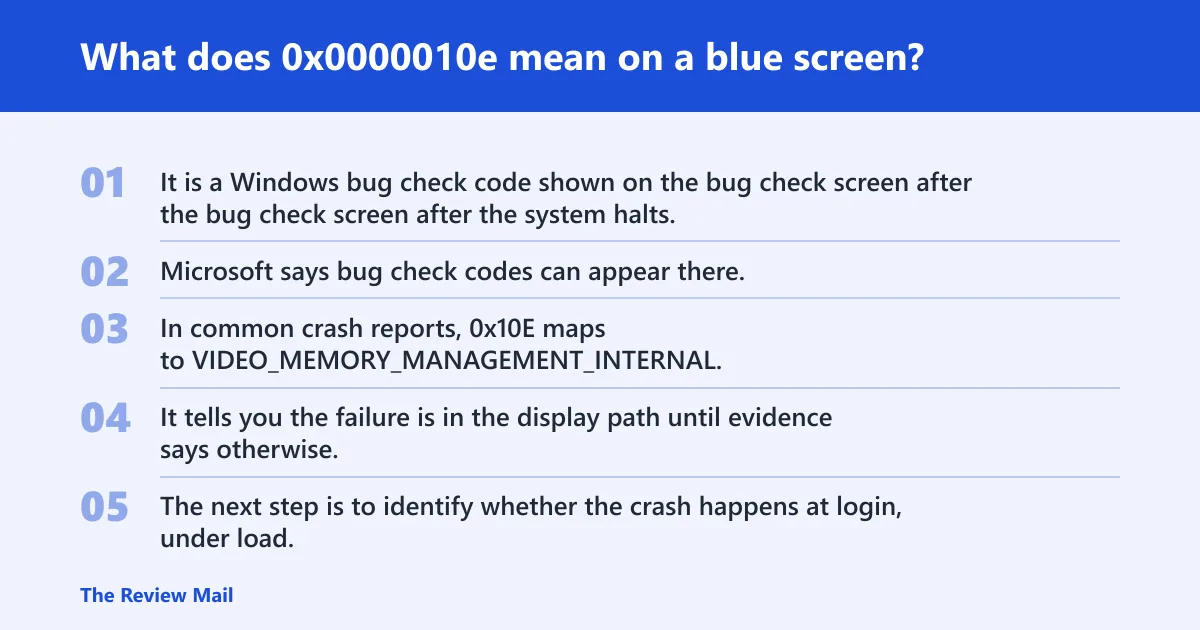
It is a Windows bug check code shown on the bug check screen after the system halts. Microsoft says bug check codes can appear there, and WinDbg’s !analyze extension is the analysis path when you have a crash dump. In common crash reports, 0x10E maps to VIDEO_MEMORY_MANAGEMENT_INTERNAL, which points to the video memory manager hitting a condition it cannot recover from (reported by bleepingcomputer.com).
That does not prove a dead GPU. It tells you the failure is in the display path until evidence says otherwise. The next step is to identify whether the crash happens at login, under load, or after a driver change.
What to check first before you change anything
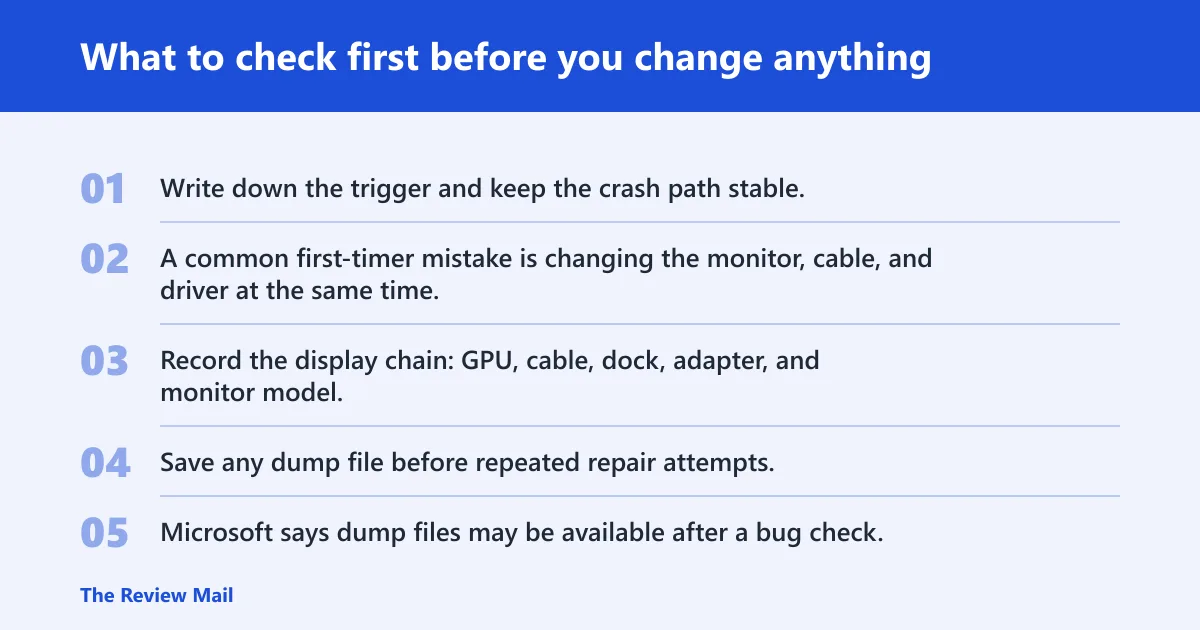
Write down the trigger and keep the crash path stable. A common first-timer mistake is changing the monitor, cable, and driver at the same time, then losing the clue that would have isolated the fault. Record the display chain: GPU, cable, dock, adapter, and monitor model.
Save any dump file before repeated repair attempts. Microsoft says dump files may be available after a bug check, and that a kernel-mode dump file captures memory for analysis. If the machine still boots, note that too; bootable and unbootable systems follow different recovery paths. (Microsoft Learn)
| Symptom pattern | What to capture now | Next step |
|---|---|---|
| Bootable, crash after login | Exact login step, account type, display chain, recent driver change | Rollback or remove the display driver first |
| Bootable, crash under load | Game launch, video playback, app name, load level, driver version | Retest the same load after a driver change |
| Unbootable, crash before desktop | Whether Safe Mode reaches desktop, last successful boot stage, dump-file presence | Open Windows Recovery Environment and preserve dumps |
| Driver updated recently | Old and new driver version, install date, whether rollback is available | Rollback to the previous version |
| Driver unchanged | Recent app installs, Windows Update state, exact trigger | Inspect the dump before broad repairs |
Likely causes, ranked by how often they fit the evidence
A common fit is a graphics or display driver that is not behaving properly. Less commonly, the dump points to a broader kernel video path issue or hardware instability, but do not jump there before checking the driver history and the exact crash trigger (reported by bleepingcomputer.com).
Say your PC bluescreens only when a 3D game starts, yet the desktop stays stable. That pattern pushes the display driver higher on the list than the panel, cable, or monitor. Suppose the crash happens right after login every time. That timing matters more than the brand of GPU.
How do I isolate the failing layer?
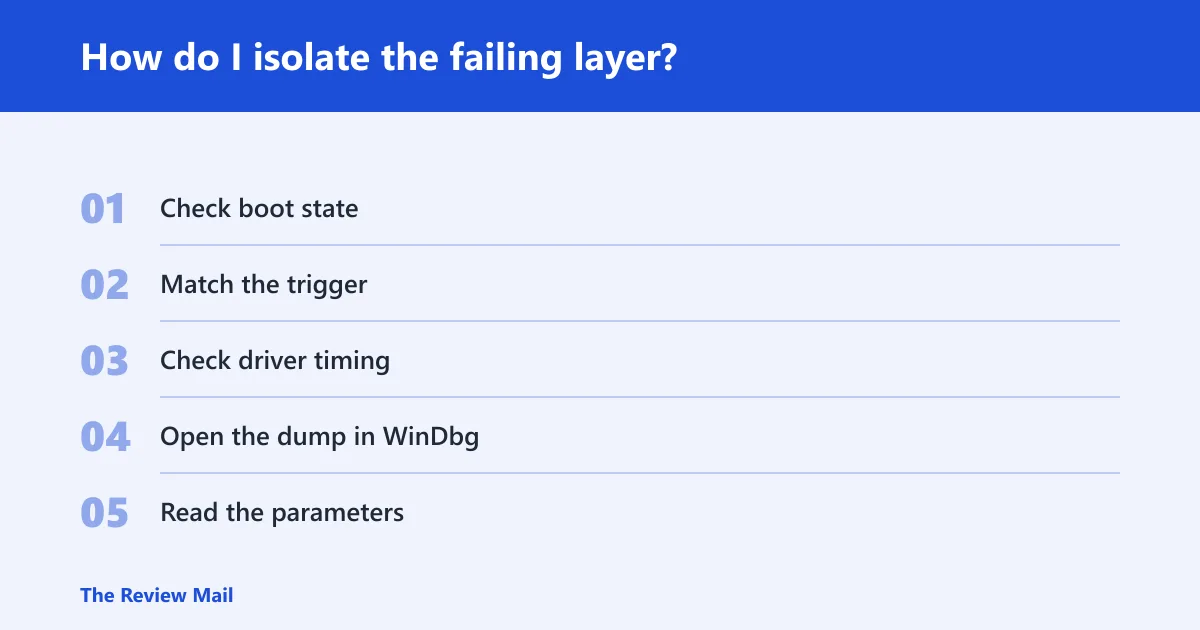
Use the same trigger, but split the decision tree into three branches: bootable versus unbootable, crash-on-login versus crash-under-load, and recent driver change versus unchanged system. Microsoft recommends !analyze -show <code> for bug check information, and if the default radix is not hex, prefix the code with 0x. Microsoft also shows that argument values can be passed to !analyze.
- Check boot state. If Windows reaches the desktop, keep the current path. If it does not, open recovery first.
- Match the trigger. Retest the same activity that caused the crash: login, resume, game launch, video playback, or monitor change.
- Check driver timing. If a display driver changed recently, treat it as the first rollback candidate.
- Open the dump in WinDbg. Use the Windows Debugger in kernel-mode context and run !analyze -show
0x0000010e. - Read the parameters. Compare the bug check name and parameter values before changing hardware.
How do I fix stop code 0x0000010e in Windows?
Start with the display driver path, because that is the most common software layer implicated by the evidence. Do one change at a time. If the crash follows the same activity after each change, keep testing that path before replacing hardware.
- Open Device Manager > Display adapters.
- Right-click the graphics/display adapter and choose Properties > Driver.
- Select Roll Back Driver if available. If not, choose Uninstall device, then restart.
- Retest the same trigger that caused the blue screen.
- If the crash continues, install a known-good driver version from the vendor or Windows Update, then retest the same trigger again.
If the crash stops after rollback, the last version was the likely fault line. If the crash continues on an older version, the dump file deserves a closer look before you move to hardware.
Can 0x0000010e be caused by a graphics driver update?
A recent graphics or display driver update is one of the first things to inspect if the crash starts after login, after launching a game, or during video playback. The evidence order matters more than a generic reinstall: version change, exact trigger, and dump-file output should come before broader repair work (reported by bleepingcomputer.com).
- Open Settings > Windows Update > Update history.
- Note the display-driver install date and version.
- Use Device Manager > Display adapters > Properties > Driver to roll back if that button is available.
- Retest the same activity that crashed the system.
- If rollback is not available, uninstall the device and reinstall one version only, then retest.
If the same crash repeats after the same activity, stop reinstalling in a loop and preserve the dump files for analysis.
What if Windows will not boot normally?
Interrupt startup until the Windows Recovery Environment appears, then move into recovery options before you make repeated repair attempts. If dump files are still present, preserve them first. That gives you the evidence needed to decide whether the next step is driver rollback, a deeper dump review, or hardware escalation.
- Power on the PC.
- As soon as Windows starts loading, hold the power button to force shutdown.
- Repeat this interrupt process until Windows Recovery Environment appears.
- Select Troubleshoot > Advanced options > Startup Settings to reach Safe Mode.
- If the dump file exists, copy it before broad repairs or reset options.
If recovery reaches Safe Mode, that is useful data: the system can boot, but the normal display path still fails.
How do I read a dump file for 0x0000010e?
Open the kernel-mode dump in WinDbg, then run the !analyze extension against the crash data. Microsoft recommends !analyze -show <code> for bug check information, and Microsoft identifies kernel-mode dump files as a way to analyze memory during a failure. The dump contains more information about memory contents at the time of the stop code.
- Launch WinDbg, the Windows Debugger, in kernel-mode analysis context.
- Open the kernel-mode dump file.
- Run !analyze -show
0x0000010e. - Check the bug check name and the parameter values.
- If the analysis points at the display driver, move to rollback or version comparison; if it points elsewhere, keep the driver chain under review before changing hardware.
Microsoft’s bug check reference also includes examples such as 0x0000000A for IRQL_NOT_LESS_OR_EQUAL, 0x0000001A for MEMORY_MANAGEMENT, and 0x0000003B for SYSTEM_SERVICE_EXCEPTION. That is useful context when comparing stop codes across different crashes.
Does 0x0000010e mean my GPU is failing?
Not by itself. Treat hardware as a conditional conclusion, not a starting assumption. If the dump points to the display path, the driver path should still be ruled out first, especially when the crash began after a graphics-driver change or only appears under a specific workload.
If the same trigger fails after rollback, a clean driver reinstall, and dump-file review, then a hardware check becomes more reasonable. At that point, capture the exact trigger, the display chain, and the dump analysis for handoff to the vendor or repair shop.
Is 0x0000010e a driver problem or hardware problem?
Most often it starts as a driver problem, especially when the video driver changed recently or the crash follows a repeatable display activity. Hardware becomes more plausible when the same trigger fails across driver versions and the dump data no longer points to a removable software layer.
Do not choose hardware first because the screen went blue. Use the trigger, the driver timeline, and the dump-file output together. That order avoids replacing parts before the cause is clear.
What tool do I use to analyze a Windows bug check code?
Use WinDbg, the Windows Debugger. Microsoft recommends its !analyze extension for bug check information, and the command syntax shown is !analyze -show <code>. If the radix is not hex, prefix the code with 0x.
The point of the tool is not only to read a stop code. It is to inspect the kernel-mode dump file, confirm the bug check name, and compare parameter values before you decide on rollback, deeper driver inspection, or hardware escalation.
What should I do if Windows won’t boot after 0x0000010e?
Get into Windows Recovery Environment, preserve any dump file, and avoid repeated reinstall attempts until the crash data is safe. If the machine cannot boot normally, you still have enough information to decide whether the next step is Safe Mode, driver rollback, or a support handoff.
- Force the PC off during startup until recovery opens.
- Enter Safe Mode from recovery.
- Copy the dump file if it is present.
- Remove or roll back the display driver only after the dump is saved.
- If recovery fails repeatedly, stop and hand off the dump data to support or a technician.
Frequently asked questions
What does 0x0000010e mean on a blue screen?
It is a stop code tied to the display path, and the key first move is to check whether the crash follows login, sleep resume, or a load event. Preserve the dump file, note any recent graphics-driver change, and use WinDbg if the PC still reaches a workable state.
Is 0x0000010e a driver problem or hardware problem?
Most cases start with a driver path, especially when the graphics/display driver changed recently or the crash repeats only under one activity. Hardware becomes a stronger candidate only after rollback, version comparison, and dump analysis still point to the same failure path.
How do I fix stop code 0x0000010e in Windows?
Start in Device Manager, roll back or uninstall the display adapter driver, and retest the same trigger that caused the crash. If the system cannot boot normally, open Windows Recovery Environment first and save the dump file before broader repair steps.
Can 0x0000010e be caused by a graphics driver update?
Yes, a driver update is one of the first things to check when the crash begins after login or under load. Compare the installed version with the previous one, then roll back if possible and retest the same activity instead of changing multiple variables at once.
How do I read a dump file for 0x0000010e?
Open the kernel-mode dump in WinDbg and run !analyze -show 0x0000010e. Review the bug check name and parameter values, then compare that output with the trigger and driver history before deciding on rollback, deeper inspection, or hardware escalation.
What tool do I use to analyze a Windows bug check code?
Use WinDbg, the Windows Debugger. Microsoft recommends its !analyze extension for bug check information, and the command syntax is !analyze -show <code>, with 0x added if the radix is not hex.