0x000000c9: What It Means and How to Check It in Windows
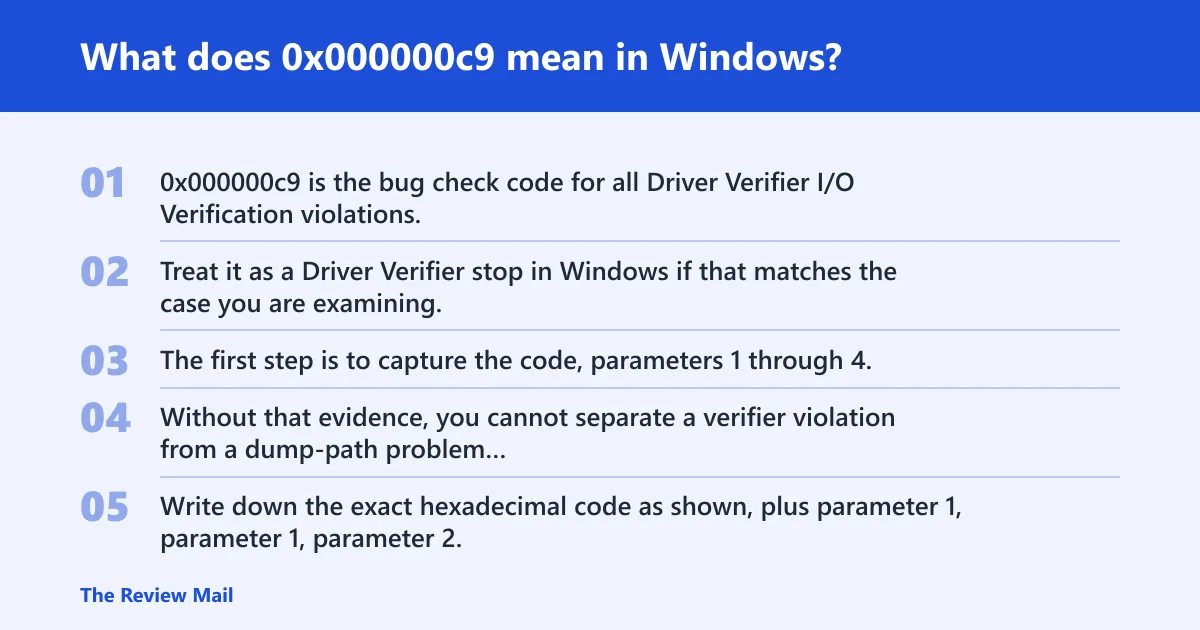
0x000000c9 is the bug check code for all Driver Verifier I/O Verification violations. Treat it as a Driver Verifier stop in Windows if that matches the case you are examining. The first step is to capture the code, parameters 1 through 4, and whether Windows wrote a dump file. Without that evidence, you cannot separate a verifier violation from a dump-path problem or a deeper kernel issue.
This guide is part of our Windows BSOD stop codes: full list and fixes series.
What does 0x000000c9 mean in Windows?
What to record right away
Write down the exact hexadecimal code as shown, plus parameter 1, parameter 2, parameter 3, and parameter 4. Keep the timestamp and the text on screen if Windows showed a module name, device object, or stack location.
Microsoft’s bug check code reference is built for programmers, and Microsoft routes customers and IT staff to different support paths for blue screens and stop code errors. Use the bug check reference for code lookup and parameter meaning when you need driver-level analysis. (Microsoft Learn)
One-page triage checklist
| Check | What to capture | Why it matters |
|---|---|---|
| Exact code | 0x000000c9 as shown on the blue screen or in Event Viewer | Confirms the stop code before any analysis |
| Parameters | Parameter 1 through parameter 4 exactly as shown | Used for bug check lookup and pattern matching |
| Dump file | Minidump, kernel dump, or live dump path and file name | Shows whether kernel analysis is possible |
| WinDbg command | !analyze -show <code> | Displays stop code information and can include parameters |
| Escalation point | Only after you have a usable dump and repeated parameters | Avoids chasing guesswork |
What should you capture before you try the crash again?
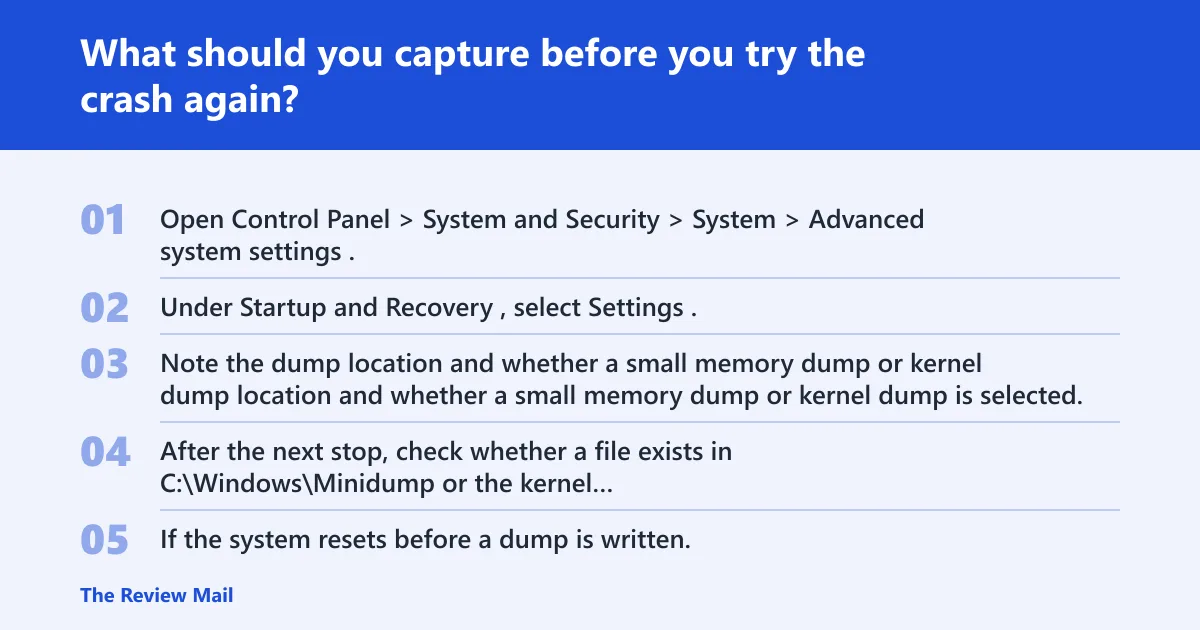
Capture the stop code, parameters 1 through 4, the time of failure, and the dump path state before reproducing the crash. Confirm the dump path works first. Only then should you repeat the failure, and only after storage and RAM checks have ruled out obvious analysis blockers.
Do this in order
- Open Control Panel > System and Security > System > Advanced system settings.
- Under Startup and Recovery, select Settings.
- Note the dump location and whether a small memory dump or kernel dump is selected.
- After the next stop, check whether a file exists in
C:\Windows\Minidumpor the kernel dump location shown in that dialog. - If the system resets before a dump is written, stop there and fix the dump path or hardware state before reproducing again.
Common triage signals
If the same parameter pattern appears on two crashes in a row, it may suggest a stable verifier path or a repeatable driver action. That repetition is useful. It often means you have a stable verifier path or a repeatable driver action, not random noise.
A common first-timer mistake is to restart the machine immediately and only then look for evidence. That can erase the timing, hide the dump state, and leave you with nothing but the stop code itself.
Likely causes of 0x000000c9, ranked for triage
Most often, this stop points to a verifier-triggered I/O violation in a driver path. Less commonly, the real blocker is a broken dump path, followed by storage or memory issues that prevent Windows from writing the evidence you need for analysis.
1. Driver or kernel-mode filter issue
Driver Verifier with I/O Verification selected may force this stop when a driver breaks I/O rules. Microsoft’s parameter meanings for 0x000000c9 map some Parameter 1 values to driver actions, such as freeing the wrong object type or passing an invalid device object.
- Check whether Driver Verifier is enabled for any non-Microsoft driver.
- Open Run and enter verifier.
- Review the selected tests and the drivers under verification.
- If one driver is implicated in the dump, roll it back, uninstall it, or update it through Device Manager.
2. Corrupt or unavailable dump path
If the dump location is missing, full, encrypted, redirected, or otherwise unavailable, the system may stop without writing the file. That leaves you with a code and no proof path, which is not enough for kernel analysis.
- Open System Properties > Advanced > Startup and Recovery.
- Verify the selected dump type and storage location.
- Check that the target drive has free space and is online.
- After the next crash, confirm that a dump file appears before trying to reproduce the issue again.
3. Storage or memory problems that block dump writing
Storage faults and memory faults can stop Windows from writing a usable dump. If the system resets too early, or if minidumps are absent after repeated crashes, treat that as a signal to inspect the write path before driver analysis.
- Run
chkdskon the system volume during a maintenance window. - Run Windows Memory Diagnostic or memtest86 as a signal check, not as a final answer.
- If faults appear, correct the hardware issue before trying to read the dump.
How do you check the dump path and file state?
You should verify the dump location before you reproduce the crash again. If the path is wrong or the file type cannot be written, deeper analysis will stall no matter how good the bug check reference is.
Check the Windows settings first
- Open Control Panel > System and Security > System > Advanced system settings.
- Under Startup and Recovery, select Settings.
- Confirm the dump type and path shown in the dialog.
- Make sure the drive is local and available at boot.
- Recheck
C:\Windows\Minidumpafter the next failure if small dumps are enabled.
Use the file presence as a triage signal
If minidumps are absent after repeated crashes, treat that as a storage, memory, or configuration signal. If a dump exists but is incomplete, stop here and move only to deeper kernel analysis with a usable file.
How do you use WinDbg to inspect 0x000000c9?
WinDbg can display stop code information, and Microsoft documents the !analyze extension for this work. The command format is !analyze -show <code>, and Microsoft notes that you can include bug check parameters when you run it.
Open the dump and run the command
- Launch WinDbg.
- Open the dump file you confirmed in the previous step.
- Run !analyze -show
0x000000c9. - If Microsoft’s reference expects a non-hex radix, prefix the code with 0x.
- Compare the output with the recorded parameter 1 through parameter 4 values.
What to look for in the output
The output may name a module, a device stack, or another failure path that gives you a place to start. If it does not, do not invent one. Use the dump data, the repeated parameter pattern, and the verifier state to decide whether you need more kernel analysis.
What if the parameters repeat across crashes?
Repeated parameter values matter because they separate a one-off event from a stable failure pattern. If parameter 1 through parameter 4 repeat, that often points to the same verifier path, the same object type, or the same driver action across crashes.
Compare events side by side
- Write the four parameters from each crash in a simple table.
- Check whether parameter 1 repeats exactly.
- Check whether the same module or device stack appears in WinDbg.
- If the pattern repeats and the dump is usable, move to deeper kernel analysis.
Escalate only when the evidence is usable
Stop here if the dump is incomplete. Escalate to deeper kernel analysis only with a usable dump, because incomplete data can send you toward the wrong driver or the wrong subsystem.
How do Microsoft references fit into the workflow?
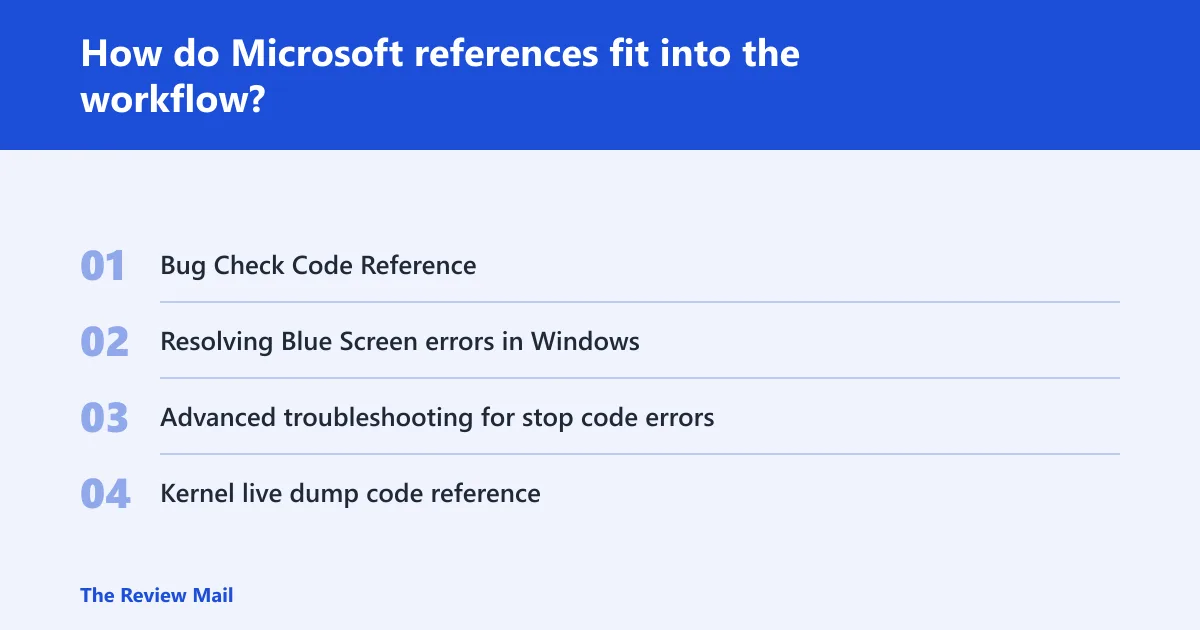
Use Microsoft’s bug check code reference for code lookup and parameter meaning, but use the customer blue-screen article for basic recovery steps and the IT-oriented troubleshooting guide when you need stop-code guidance for support work. Live dump stop codes are separate and do not reset the operating system.
Where each reference fits
- Bug Check Code Reference: developer-facing lookup table for stop codes.
- Resolving Blue Screen errors in Windows: customer-facing recovery path.
- Advanced troubleshooting for stop code errors: IT-oriented follow-up.
- Kernel live dump code reference: separate from bug check codes and used for live dump stop codes.
How to choose the next path
If the issue is basic recovery, use the customer article. If you need stop-code workflow for support, use the IT guide. If the dump is usable and the stop repeats, move into WinDbg and the developer reference.
What should you do first after getting a blue screen with 0x000000c9?
Your first move is to write down the exact code, the four parameters, and whether a dump file was written. After that, verify the dump path before you retry the crash, because reproducing the fault without a working path can waste the only evidence you have.
Fast first pass
- Record the exact screen text and the time of failure.
- Note parameter 1 through parameter 4 exactly as shown.
- Check for a dump file in the configured location.
- Only after that, decide whether to reproduce the crash again.
Is 0x000000c9 a driver problem or hardware problem?
It is often a driver-verifier path problem, but you should not stop there. Hardware can still interfere with dump writing, and a missing or incomplete dump can hide the true failure path until storage and memory are checked enough for analysis.
Separate the likely paths
- If WinDbg names a driver or device stack, start there.
- If no dump is written, inspect the dump path, storage, and memory state.
- If Windows Memory Diagnostic or memtest86 reports faults, treat that as a follow-up signal and verify the machine before deeper driver work.
How is 0x000000c9 different from other BSOD stop codes?
This stop code is tied to Driver Verifier I/O Verification, so the parameter values matter more than a generic blue-screen label. Unlike broad stop codes that need only a basic lookup, this one benefits from parameter-first triage and a dump-aware workflow.
Why the comparison matters
A stop code with repeated parameters, a verifier context, and a usable dump can move quickly into module analysis. A stop code with no dump and no stable parameter pattern should stay in evidence-collection mode first.
Frequently asked questions
How do I find which driver caused 0x000000c9?
Open the dump in WinDbg and run !analyze -show 0x000000c9, then compare the output with the recorded parameter 1 through parameter 4 values. If WinDbg names a module or device stack, that is your starting point. If it does not, do not guess; collect a better dump first.
Can WinDbg analyze bug check 0x000000c9?
Yes. Microsoft says bug check codes can be displayed with the !analyze extension in WinDbg, and the command syntax is shown as !analyze -show <code>. Open the dump file first, then include the exact stop code and parameters from the crash screen.
Where can I look up the bug check parameters for 0x000000c9?
Use the Microsoft Learn Bug Check Code Reference for the parameter table and stop-code lookup. It is developer-oriented, so it is the right place for the parameter meanings, while the customer blue-screen article covers the basic recovery path for non-developers.
Do I need a memory dump to troubleshoot 0x000000c9?
A usable dump is the fastest path to kernel analysis. Dump files can contain more information about memory contents at the time of failure, and that may be necessary to understand the stop. If the dump is incomplete or missing, fix the dump path and system state first.
What should I do first after getting a blue screen with 0x000000c9?
Capture the exact code, parameter 1 through parameter 4, and the failure time before anything else. Then verify that the configured dump path works and that a file exists after the next crash. That sequence gives you a real analysis path instead of a guess.
Is 0x000000c9 a driver problem or hardware problem?
It is usually a driver-verifier I/O violation, but hardware and storage problems can still prevent a useful dump from being written. Check the dump path, storage, and memory state before you chase a specific driver. If a module appears in WinDbg, follow that lead next.