0x0000004a BSOD: Driver or RAM? Meaning and Repair
Stop code 0x0000004A is IRQL_GT_ZERO_AT_SYSTEM_SERVICE. Officially, it indicates that a thread is returning to user mode from a system call when its IRQL is still above PASSIVE_LEVEL. I start with dump analysis and recent low-level software changes, because guessing can waste hours and keep triggering blue screens on production PCs. If you want the broader crash-handling workflow first, see our Windows BSOD troubleshooting guide.
This guide is part of our Windows BSOD stop codes: full list and fixes series.
What does 0x0000004a mean in Windows BSOD?
Microsoft documents this bug check as 0x0000004A for IRQL_GT_ZERO_AT_SYSTEM_SERVICE. The stop code describes the state Windows detected at the crash, but it does not prove a single root cause by itself. (community.spiceworks.com)
What the stop code usually says about the crash
Because this stop points to a low-level kernel state, dump analysis is more useful than a screenshot or a single blamed filename. Microsoft’s bug check reference is the primary source for the code definition, and WinDbg is the right next step when you need to sort out whether a third-party driver is involved or whether the dump needs closer review. If you need a refresher on debugger basics, use our WinDbg crash dump analysis guide alongside the Microsoft bug check page. (Microsoft Learn)
Common causes to check are third-party kernel drivers and memory corruption. Microsoft is careful here: the stop code identifies the failure condition, not a guaranteed culprit.
Why ntoskrnl.exe or ntkrnlmp.exe is often a false lead
If a dump highlights ntoskrnl.exe or ntkrnlmp.exe, do not assume the Windows kernel itself is the root cause. Those modules are often where the system finally stopped, so they can be the last code touched rather than the component that caused the failure.
If a full MEMORY.DMP exists, use it before relying on a minidump. A full or kernel dump usually provides more context than a small memory dump and gives you a better chance of finding the driver path involved before the system crashed.
What usually causes 0x0000004a?
The first things to check are recent low-level software changes and third-party drivers, because they can affect the kernel path involved in this stop code. If no clear software lead appears in the dump, memory corruption is still a possibility. The key is to use the dump and recent system changes to choose the next test instead of assuming one cause from the stop code alone.
Ranked likely causes
- Third-party driver corruption. Start here if crashes began after a recent driver or low-level software change.
- Memory corruption. Consider this when crashes are inconsistent across dumps and no single non-Microsoft driver stands out.
- Windows file corruption. Check this branch if Windows also shows file-repair or update problems.
Recent changes that matter most
Start with the last exact change before the first crash: a driver package, firmware change, low-level utility, or other software that adds drivers or filters. Reset any overclock or undervolt first so you are testing a stable baseline. If system file repair is part of your branch, our SFC and DISM repair walkthrough fits after dump review, not before it.
Home PC vs workstation or server patterns
On any system type, the useful pattern is the same: compare the first crash date with the last low-level software or firmware change, then confirm what the dump shows before changing more than one thing at a time.
Which clues point to a driver, RAM, or kernel noise?
The fastest triage comes from combining the bug check, crash context, and the stack shown in WinDbg. Do not treat the parameters as a complete answer by themselves; use the debugger output to decide whether a recent third-party driver is the main lead or whether you need a broader review of the dump. Microsoft’s bug check page is the authority for the code definition, and the debugger step below is the practical next move.
One-page triage table for 0x0000004a
| Dump clue or parameter pattern | Crash context | What it usually suggests | Driver vs RAM vs kernel noise | Best next action |
|---|---|---|---|---|
| WinDbg shows BugCheck 4A; !analyze -v highlights one recent non-Microsoft module; stack text repeats that module | Started after a driver or low-level software change | A third-party driver is the lead | Driver | Roll back or uninstall the recent driver or software, then retest |
| BugCheck 4A with ntoskrnl.exe or ntkrnlmp.exe appearing alone; stack is limited or unclear; no clear vendor module | Random times or mixed workloads | The kernel may only be the last code touched | Kernel noise | Use the full MEMORY.DMP if available, confirm symbols, and rerun !analyze -v |
| BugCheck 4A repeats but the named module changes across dumps; no single driver path stands out | Different workloads with no clear software trigger | Memory corruption becomes more plausible | RAM | Run Windows Memory Diagnostic and review the full dump again |
| BugCheck 4A appears along with Windows file-repair or update problems; dump review stays inconclusive | Startup or update cycle | Windows file corruption may be involved | Kernel noise | Run sfc /scannow, then DISM /Online /Cleanup-Image /RestoreHealth if needed |
| Verifier-induced crash arrives faster and names one non-Microsoft driver | Soon after enabling Verifier | High-confidence driver fault | Driver | Remove or replace that driver first, then retest with Verifier off |
How do I check which driver caused bugcheck 0x0000004a?
Open MEMORY.DMP in WinDbg, set the Microsoft symbol server, run !analyze -v, and inspect the blamed module, stack text, and bug check details together. If the stack points at a recent non-Microsoft driver, test that branch first. If it only points at ntoskrnl.exe, treat it as a clue rather than a verdict.
Open the dump and set symbols
- Install WinDbg, then open File > Open dump file and load
C:\Windows\MEMORY.DMPif it exists. Use the newest full dump available. - In WinDbg, open File > Symbol File Path and enter SRV*C:\Symbols*https://msdl.microsoft.com/download/symbols, which is the standard Microsoft public symbol server format.
- At the command line, run !analyze -v. Officially, the !analyze debug extension displays information about the bug check and can help determine the root cause.
- Read the MODULE_NAME, IMAGE_NAME, stack text, and bug check details together. A single field by itself is often not enough to identify the actual driver involved.
What to look for in the output
Start with the non-Microsoft module, if one is shown repeatedly in the stack or analysis output, then compare it with recent driver or software changes. If the dump keeps naming only core Windows files, move to Driver Verifier or memory testing based on the system’s recent change history.
Is 0x0000004a caused by a bad driver or bad RAM?
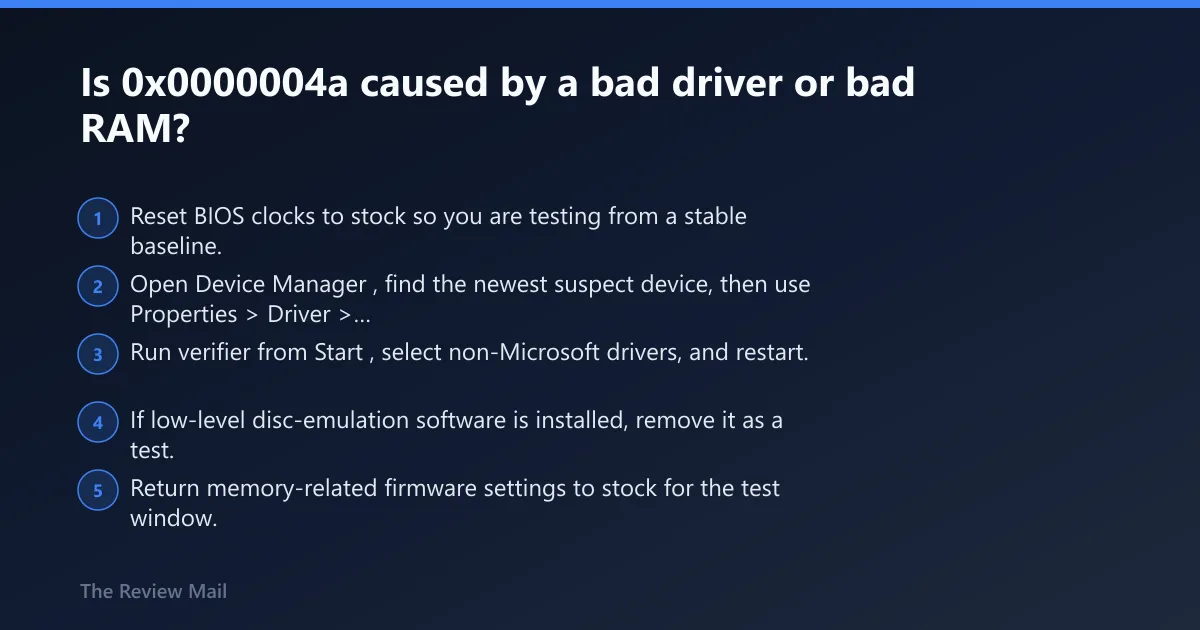
A driver is the first branch to test when crashes start after a recent software or driver change and the dump shows a possible third-party module. Memory testing makes more sense when dumps vary widely or when no clear software lead appears after review. Use that order to avoid replacing hardware before you have checked the most direct software path.
If driver evidence is stronger, try this next
- Reset BIOS clocks to stock so you are testing from a stable baseline.
- Open Device Manager, find the newest suspect device, then use Properties > Driver > Roll Back Driver if available. If rollback is not available, use Uninstall Device and restart Windows.
- Run verifier from Start, select non-Microsoft drivers, and restart. Use it carefully because it can force a faster crash on an unstable driver.
- If low-level disc-emulation software is installed, remove it as a test. BleepingComputer has reported that Daemon Tools and Alcohol % software are known to cause BSODs on some Windows systems, and the reported recommendation is to uninstall the program and use the vendor’s free removal tool to ensure sptd.sys is removed, choosing the 32-bit or 64-bit version that matches your system.
If RAM evidence is stronger, try this next
- Return memory-related firmware settings to stock for the test window.
- Run Windows Memory Diagnostic by pressing Start, typing Windows Memory Diagnostic, then choosing Restart now and check for problems. For a step-by-step flow, see our MemTest86 and RAM troubleshooting guide. (Microsoft Learn)
- If the test reports errors, troubleshoot memory before making more software changes.
- If the test reports no errors but crashes continue, go back to the full dump, confirm symbols, and compare multiple crash stacks for a repeating driver pattern.
Should I run Driver Verifier or MemTest after 0x0000004a?
Run Driver Verifier first when the crash began after a driver or low-level software change and the dump still points more strongly toward software. Run Windows Memory Diagnostic first when no clear third-party driver stands out after dump review.
If that did not work, move down the ladder
- If Verifier catches a non-Microsoft driver, remove or replace that driver and retest with Verifier turned off.
- If Verifier does not identify a driver, run Windows Memory Diagnostic next.
- If both checks stay inconclusive, return to the full MEMORY.DMP, confirm symbols, and review multiple dumps side by side for a repeating non-Microsoft module or stack pattern.
What if dump analysis points nowhere useful?
When WinDbg only shows ntoskrnl.exe, ntkrnlmp.exe, or a broken-looking stack, treat the case as incomplete rather than solved. At that point, verify symbols, use the full dump if available, and check Windows files before moving on to more invasive changes.
OS and storage branch
- Open Command Prompt as administrator and run
sfc /scannow. This checks protected Windows files. - If SFC reports issues or Windows update repair is needed, run
DISM /Online /Cleanup-Image /RestoreHealth, then runsfc /scannowagain. - If you recently installed or removed low-level utilities, undo that change and retest.
- Avoid registry cleaners and generic driver-updater tools while troubleshooting.
Safe Mode, startup, and vendor-specific notes
If 0x0000004a appears on startup, boot into Safe Mode first so Windows loads fewer third-party drivers. On Windows 11, open Settings > System > Recovery > Advanced startup > Restart now. On Windows 10, use Settings > Update & Security > Recovery > Advanced startup > Restart now.
After Safe Mode boots, remove the newest suspect driver or software package, then restart normally. If Safe Mode works and normal boot does not, that still points more strongly to a software or driver path than to a confirmed hardware failure.
What should I collect before asking for help on 0x0000004a?
A useful escalation bundle includes the full dump, the exact bug check line, WinDbg output, hardware identity, and a short timeline of changes. That gives the next person enough context to choose the right branch quickly.
Escalation checklist
- Save
C:\Windows\MEMORY.DMPand any files inC:\Windows\Minidump. - Copy the WinDbg output from !analyze -v, including bug check details, stack text, and the named module.
- Write down the exact system model, motherboard model, BIOS version, CPU, GPU, storage devices, and RAM configuration.
- List recent changes in order: driver installs, BIOS updates, RAM changes, overclocks, undervolts, security software changes, VM software, and cleanup tools.
- Note whether the crash happens at startup, idle, gaming, resume, backup, or another repeatable workload.
Prevention
Keep one stable baseline. Leave clocks at stock until the machine is proven stable, and make one low-level change at a time so the next crash still points somewhere useful. It also helps to keep symbols configured in WinDbg before you need them.
Frequently asked questions
What does 0x0000004a mean in Windows BSOD?
Start with the dump, not a guess. Open C:\Windows\MEMORY.DMP in WinDbg, set the symbol path to SRV*C:\Symbols*https://msdl.microsoft.com/download/symbols, and run !analyze -v.
What does IRQL_GT_ZERO_AT_SYSTEM_SERVICE mean?
Use the Microsoft bug check page and the dump together. The practical next step is to review the stack and any repeating non-Microsoft driver in WinDbg before changing hardware.
How do I check which driver caused bugcheck 0x0000004a?
Use WinDbg on the full dump if available. Load MEMORY.DMP, set symbols with the SRV path, run !analyze -v, and compare the named module with the stack and the last driver or software change on the machine. If you need the workflow, start with our WinDbg guide.
Should I run Driver Verifier or MemTest after 0x0000004a?
Run Driver Verifier first if crashes started after a driver or software change and the system is stable at stock settings. Run Windows Memory Diagnostic first if dumps vary across crashes and no single software lead stands out.
Can a graphics or chipset driver trigger 0x0000004a?
A third-party kernel driver can be involved, but the dump should guide that call. Use Device Manager > Properties > Driver to roll back the newest suspect before changing multiple drivers at once.
Do I need WinDbg to analyze a MEMORY.DMP file?
For a serious 0x0000004a case, yes. WinDbg with the Microsoft symbol server and !analyze -v gives the stack and bug check information you need for the next step.