Event 1000 Application Error
Event ID 1000 usually means Windows logged an Application Error for a crashing program, and the fastest first step is to sort the crash by faulting module and exception code before changing anything.
Crash details that matter
Find the entry in Event Viewer under Windows Logs > Application. The source is commonly Application Error, and the event records the fields that matter most: faulting application name, faulting module name, exception code, and fault offset. Microsoft’s Event Viewer and Windows Error Reporting documentation describes this crash metadata and the way WER can generate and store crash information and dumps.
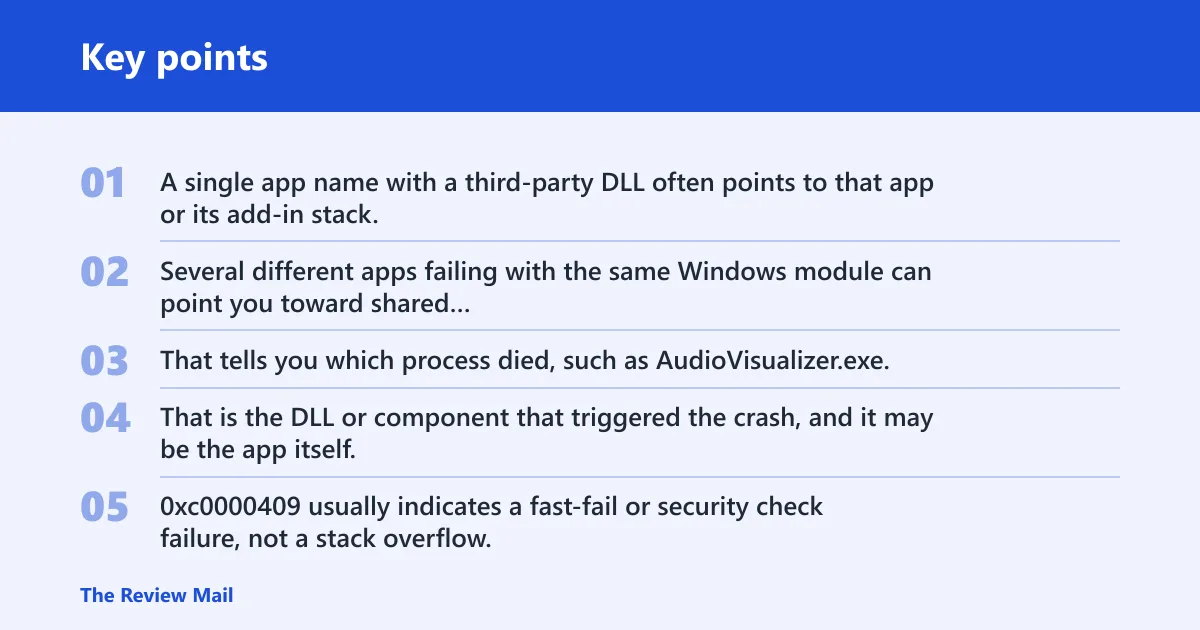
That set is the evidence trail. A single app name with a third-party DLL often points to that app or its add-in stack. Several different apps failing with the same Windows module can point you toward shared runtime files, shell components, or a broader system problem.
How to read the crash details
Start with the faulting application name. That tells you which process died, such as AudioVisualizer.exe, Razer Synapse Service Process.exe, explorer.exe, or dwm.exe. Then read the faulting module name. That is the DLL or component that triggered the crash, and it may be the app itself, a Windows system DLL, or a third-party file.
The exception code is the next filter. 0xc0000005 means access violation. 0xc0000409 usually indicates a fast-fail or security check failure, not a stack overflow; that distinction matters because it often points to a different class of bug. Event logs can also show 0xe0434352, 0xc000041d, or 0xc0000374 as the exception code, so copy the exact value before you change anything.
The fault offset matters when you open a dump in WinDbg. It points to the code location where the fault surfaced, which helps when the same module appears across several events.
What WER records in the event
Windows Error Reporting logs the crash metadata and can link to crash dumps. On many systems, dumps are written to Users\[Username]\AppData\Local\CrashDumps, but the exact dump path can vary with policy and configuration. Microsoft documents WER as the crash-reporting component and WinDbg as the tool for opening and analyzing user-mode crash dumps. If the event points to one app and one module every time, that is a narrower problem than a pattern that spreads across many unrelated processes.
Microsoft sources for this workflow
Microsoft’s documentation for Event Viewer, Windows Error Reporting, SFC, DISM, crash-dump collection, and WinDbg supports the workflow in this guide: identify the event in Application log, interpret the faulting app and module, repair Windows files when the pattern spans multiple apps, and inspect a dump when Event Viewer does not show the real owner.
How to classify the crash pattern
Classify the crash first by who owns the module, then by how many apps fail. A single app crashing with its own DLL or a known add-in points to the app layer. Repeated crashes in unrelated programs with ntdll.dll or KERNELBASE.dll often point to a downstream fault. Shell processes like explorer.exe and dwm.exe sit closer to Windows graphics, shell extensions, or display drivers.
Say your music app fails every time AudioVisualizer.exe loads a specific plugin DLL. That is a strong app-layer clue. Suppose Excel, Outlook, and a browser all fail in different ways, but each event still lands on KERNELBASE.dll. That pattern shifts suspicion toward a shared runtime, a corrupt file, or memory instability.
- Single-app crash: check the app version, add-ins, overlays, plugins, and the app’s own log.
- Shared runtime or system file issue: run
DISM /Online /Cleanup-Image /RestoreHealth, thensfc /scannow, and check whether the faulting module is a Windows file or a vendor DLL. - Driver or shell component issue: focus on display, audio, shell-related processes, and the Windows components that handle the desktop.
- Multiple apps crashing: run Windows memory and storage checks, then review recent updates, drivers, and system changes.
Crash triage table
| Faulting module | Common owning layer | Likely cause | Common exception patterns | File path or location clue | App-count pattern | First verification step | Next verification step |
|---|---|---|---|---|---|---|---|
| kernelbase.dll | Windows runtime or app wrapper | The app raised an exception that surfaced through a Windows layer; not automatically a broken Windows install | 0xc0000005, 0xc0000409, 0xe0434352 | Usually under the Windows system directory; often not the file that is actually at fault | One app repeating, or several apps with the same runtime path | Check whether the same app fails every time or whether several apps share the same code path | Look for a vendor DLL, runtime mismatch, or system-file corruption before reinstalling Windows |
| ntdll.dll | Windows runtime | Access violation, bad memory write, or a downstream fault that reaches the NT layer | 0xc0000005, 0xc0000374, 0xc0000409 | Windows system directory; the visible failure may originate in a different module | Often several unrelated apps when the issue is deeper than one program | Compare the exception code across recent entries and see whether different apps fail | Run Windows memory diagnostics and review recent drivers, overlays, and security software hooks |
| explorer.exe | Shell component | Shell extension, context-menu handler, icon handler, or file association trouble | 0xc0000005, 0xc0000409, occasionally app-specific COM failures | Shell actions such as folder browsing, desktop interaction, or right-click menus | Usually one shell process, but can affect multiple Explorer windows and related UI actions | Test whether the crash happens while opening folders, the desktop, or right-click menus | Test in Safe Mode or a clean boot and compare behavior |
| dwm.exe | Desktop Window Manager and graphics stack | Display driver, overlay, theme, or GPU path issue | 0xc0000005, 0xc0000409, graphics-stack related faults | Visual effects, window compositing, fullscreen transitions, or hardware acceleration | Can appear as one desktop process crash, but may coincide with many apps that draw heavily | Update the graphics driver and check whether the crash follows visual effects or fullscreen apps | Check for overlay tools, GPU driver regressions, and shell/desktop composition issues |
| third-party DLL | App vendor or add-in | Plugin bug, old runtime, antivirus hook, overlay, or corrupted app component | 0xc0000005, 0xc0000409, or app-specific exceptions | Often under the app’s install folder or a vendor add-in path | Usually one app, one plugin, one workflow, or one vendor stack | Disable the add-in or reinstall the app component that owns the DLL | Check whether the same DLL appears in every crash and whether the vendor has a known fix |
Why kernelbase.dll or ntdll.dll is listed
KERNELBASE.dll and ntdll.dll are common faulting modules because they sit low in the Windows call path. That makes them frequent crash wrappers, not automatic proof that Windows itself is broken. A problem in the app can bubble up through either file.
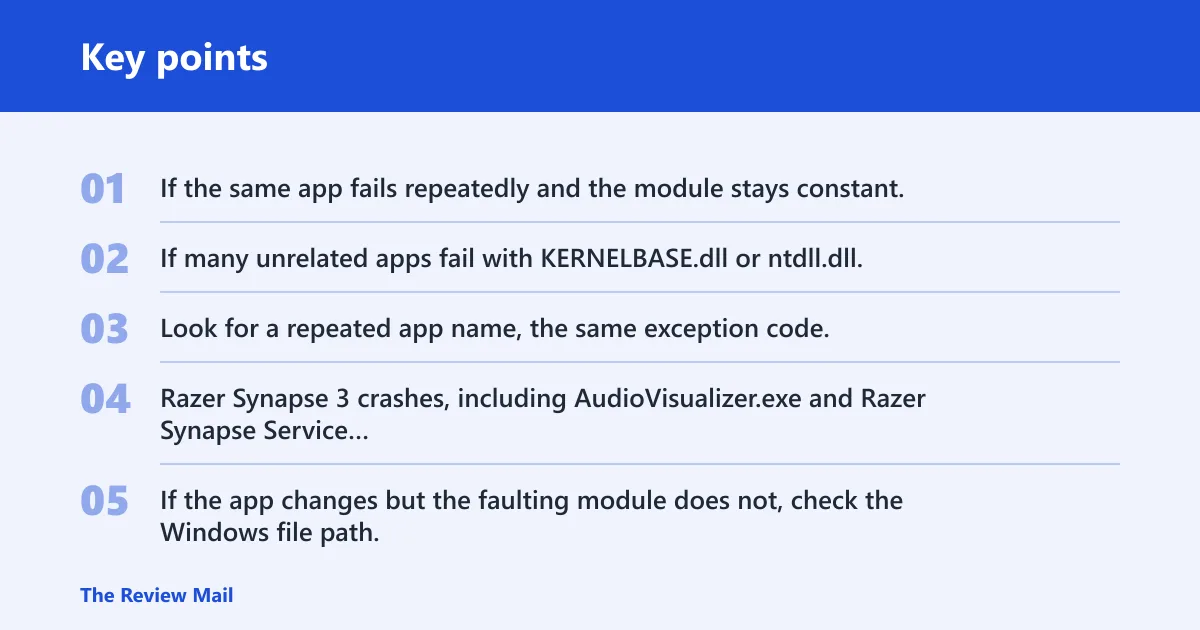
If the same app fails repeatedly and the module stays constant, the app or its add-ins are still the first suspects. If many unrelated apps fail with KERNELBASE.dll or ntdll.dll, the balance shifts toward a shared runtime, corrupted system files, or unstable memory.
When these modules point to the app
Look for a repeated app name, the same exception code, and one plugin or DLL that appears every time. Razer Synapse 3 crashes, including AudioVisualizer.exe and Razer Synapse Service Process.exe, are a good example of a vendor stack where the owning layer can sit above Windows, even when the crash is logged through a Windows module.
When these modules point to Windows files
If the app changes but the faulting module does not, check the Windows file path, recent updates, and system file health. That is the point where DISM and SFC move ahead of app reinstall steps.
What to do if explorer.exe keeps crashing
If explorer.exe keeps crashing, treat it as a shell problem first, not a generic app error. The usual suspects are shell extensions, context-menu handlers, icon handlers, preview handlers, or a bad file association. The fastest proof step is to check whether the crash happens during folder browsing, right-click actions, or desktop redraws.
- Note the exact action that triggers the crash, such as opening a folder, right-clicking a file, or loading the desktop.
- Boot into Safe Mode and retest. If the crash stops there, the problem is more likely to involve a non-Microsoft shell component or another third-party startup item.
- Update the graphics driver if the crash happens during shell redraws or desktop refresh.
- Run DISM and SFC if several shell actions fail or the event pattern spreads.
What to do if dwm.exe keeps crashing
If dwm.exe is the faulting process, focus on display and composition first. Desktop Window Manager sits on top of the graphics stack, so a driver regression, overlay tool, theme component, or hardware-acceleration conflict can produce the crash. A single dwm.exe event can still be the visible symptom of a driver problem that also affects other apps.
- Update or roll back the graphics driver based on when the crash started.
- Disable overlays, RGB tools, screen recorders, and similar GPU-hooking utilities.
- Check whether the crash follows fullscreen apps, alt-tab, or sleep/wake transitions.
- If games or graphics-heavy apps are involved, install the DirectX End-User Runtime and retest the same workload.
What to do if multiple apps crash
If several unrelated apps fail, the pattern is broader than one program. Start with system file repair, then move to runtimes and drivers. That order makes sense when the faulting module changes from app to app but the exception code or Windows layer keeps repeating.
- Open an elevated Command Prompt and run
DISM /Online /Cleanup-Image /RestoreHealth. - Then run
sfc /scannow. - Install Visual C++ Redistributables from 2005 through 2015-2022 if the crash pattern fits a runtime gap.
- If games or graphics-heavy apps are involved, install the DirectX End-User Runtime.
- Update graphics, audio, and chipset drivers from the device or system vendor.
- Run Windows Memory Diagnostic from the Start menu if crashes affect multiple apps or the system looks unstable.
Also check storage health if the crashes appear after a power loss, a failed update, or other disk symptoms. System file repair cannot fix an unstable SSD or RAM fault.
To check storage health, open Settings > System > Storage to review available space, then open an elevated Command Prompt and run chkdsk /scan to look for file system issues. If Windows reports disk errors, follow the prompts to schedule a repair and retest after the restart.
Still not working?
Open the crash dump in WinDbg when Event Viewer does not give a clear owner. Load the dump from Users\[Username]\AppData\Local\CrashDumps or from the configured WER dump location and run !analyze -v. That output shows the call stack and often identifies the real module behind the visible crash wrapper.
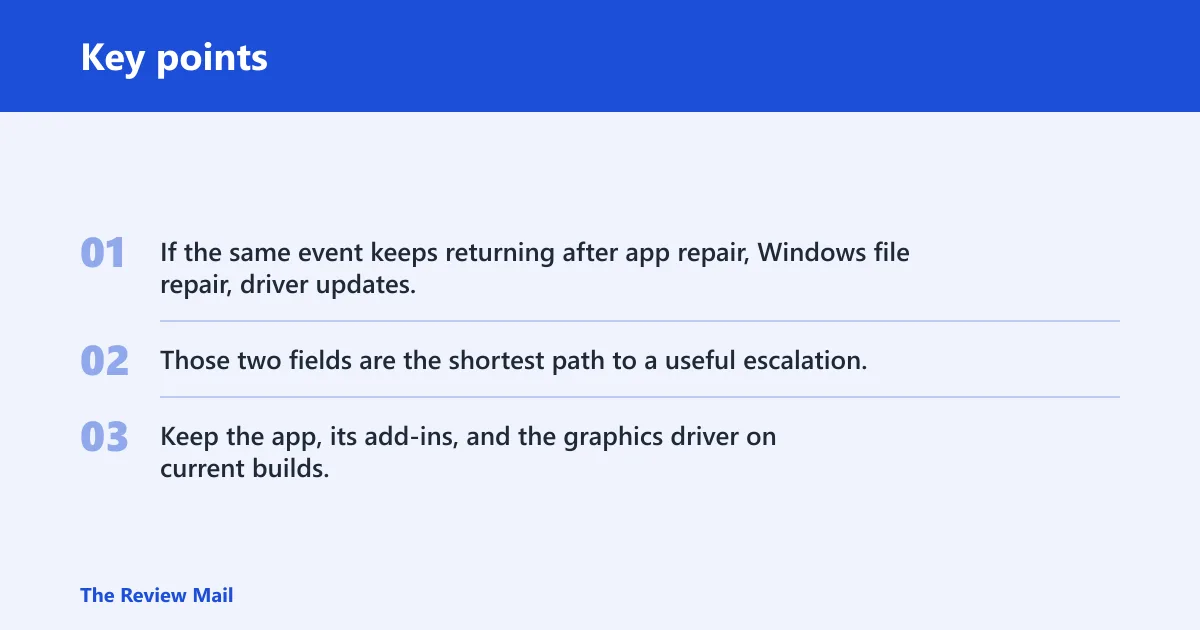
If the same event keeps returning after app repair, Windows file repair, driver updates, and memory testing, ask the app vendor or device maker for support with the exact faulting module and exception code. Those two fields are the shortest path to a useful escalation.
Keep the app, its add-ins, and the graphics driver on current builds, and avoid piling multiple overlay tools into the same process chain.
When to reinstall the app versus repair Windows
Reinstall or repair the app when one program keeps crashing and the same vendor DLL, add-in, or plugin appears in the event every time. Repair Windows when the crash pattern spreads across multiple apps, the faulting module changes between events, or the same Windows-layer module appears across unrelated programs. When the evidence is mixed, start with the smallest fix that matches the pattern, then move outward.
Frequently asked questions
What does event 1000 application error mean?
It means Windows logged an application crash in Event Viewer under Windows Logs > Application with source Application Error. The useful fields are the faulting application name, faulting module name, exception code, and fault offset. Start by matching those fields to one app or one shared module.
How do I find the faulting module in Event Viewer?
Open Event Viewer > Windows Logs > Application, then filter for Application Error and the event ID. Open the event and read the Faulting module name line in the General tab. Copy the exact DLL or EXE name before you change anything.
What does exception code 0xc0000005 mean in event 1000?
0xc0000005 is an access violation. That usually means something tried to read or write memory it should not have touched. Check whether the same app always fails, or whether several different apps show the same code with different modules, which points you toward a broader fault.
What does exception code 0xc0000409 mean in event 1000?
0xc0000409 is typically a fast-fail or security check failure. In practice, it can show up when a program detects corrupted state, a buffer issue, or another serious internal problem. It is not the same thing as a stack overflow, so do not treat it as one.
Why does event 1000 keep showing kernelbase.dll?
KERNELBASE.dll is often the layer where an app crash surfaces, so it can appear even when the app itself is the problem. If one app repeats the same module, repair that app first. If many apps do it, move to DISM, SFC, and memory checks.
What does event 1000 application error on Windows 11 mean?
The basic triage is the same on Windows 11. Open Event Viewer, go to Windows Logs > Application, read the faulting application, module, and exception code, then choose the fix that matches the owning layer. The interface changes, not the crash logic.
Should I reinstall the app or repair Windows files for event 1000?
Choose based on the module pattern. Reinstall or repair the app when one program keeps crashing and the module points to its own DLLs or add-ins. Use DISM and SFC when multiple apps fail, ntdll.dll or KERNELBASE.dll appears across different programs, or the system feels unstable.
How should I handle explorer.exe crashes?
Start with shell extensions, context-menu handlers, icon handlers, and file associations. If the crash appears during desktop redraws or folder navigation, also check display drivers and shell-related add-ins. If the issue affects multiple shell actions, move to DISM and SFC.
How should I handle dwm.exe crashes?
Focus on the graphics path: display drivers, overlays, hardware acceleration, and GPU-bound utilities. If the same crash follows fullscreen apps or visual transitions, the driver stack becomes the first place to investigate.
What should I do when multiple apps crash with the same module?
That pattern usually points to a shared runtime, a Windows file issue, or memory instability. Repair Windows files, update runtimes, test memory with Windows Memory Diagnostic, and review recent driver or software changes before reinstalling individual apps one by one.